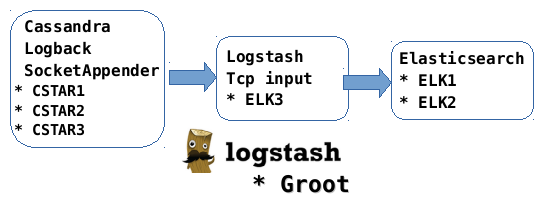
The following is a model of setting up Cassandra logging for an existing ELK and Cassandra cluster.
provision cluster
Do the following from within the directory holding the docker-compose.yml file related to this repo:
docker-compose up -d
Do all of the following on each C* node:
install filebeat on each node
apt update
apt install curl -y
curl -L -O https://artifacts.elastic.co/downloads/beats/filebeat/filebeat-6.2.3-amd64.deb
dpkg -i filebeat-6.2.3-amd64.deb
for other operating systems, see: https://www.elastic.co/guide/en/beats/filebeat/current/filebeat-installation.html
create configuration file
edited from example at: https://github.com/thelastpickle/docker-cassandra-bootstrap/blob/master/cassandra/config/filebeat.yml
Put the following in /etc/filebeat/filebeat.yml.
output.elasticsearch:
    enabled: true
    hosts: ["172.16.238.31:9200"]
setup.kibana:
  host: "172.16.238.33:5601"
filebeat.prospectors:
    - input_type: log
      paths:
        - "/var/log/cassandra/system.log*"
      document_type: cassandra_system_logs
      exclude_files: ['\.zip$']
      multiline.pattern: '^TRACE|DEBUG|WARN|INFO|ERROR'
      multiline.negate: true
      multiline.match: after
    - input_type: log
      paths:
        - "/var/log/cassandra/gc.log.*.current"
      document_type: cassandra_gc_logs
      exclude_files: ['\.zip$']
      multiline.pattern: '^TRACE|DEBUG|WARN|INFO|ERROR'
      multiline.negate: true
      multiline.match: after
set up kibana dashboards
filebeat setup --dashboards
output: Loaded dashboards
start the beat
service filebeat start
Example output:
2018-04-12T20:43:03.798Z    INFO    instance/beat.go:468    Home path: [/usr/share/filebeat] Config path: [/etc/filebeat] Data path: [/var/lib/filebeat] Logs path: [/var/log/filebeat]
2018-04-12T20:43:03.799Z    INFO    instance/beat.go:475    Beat UUID: 2f43562f-985b-49fc-b229-83535149c52b
2018-04-12T20:43:03.800Z    INFO    instance/beat.go:213    Setup Beat: filebeat; Version: 6.2.3
2018-04-12T20:43:03.801Z    INFO    elasticsearch/client.go:145 Elasticsearch url: http://172.16.238.31:9200
2018-04-12T20:43:03.802Z    INFO    pipeline/module.go:76   Beat name: C1
Config OK
run some test data
cassandra-stress write n=20000 -pop seq=1..20000 -rate threads=4
view the graphs
Open this in a browser: http://localhost:5601
Sample queries:
- message:WARN*
- message:(ERROR* OR WARN*)
- message:(ERROR* OR WARN*) AND beat.hostname:DC1C2
Can also filter display by choosing from available fields on left.