As our business has been growing rapidly over the years, showcasing relevant content in the form of banners and carousels on high-traffic surfaces like the home page has become harder to support reliably. There has been an exponential increase in load on multiple systems such as application pods, databases, and caches, which is expensive to support and maintain. Before diving deeper into the details, let’s define some of the content such as banners and carousels.
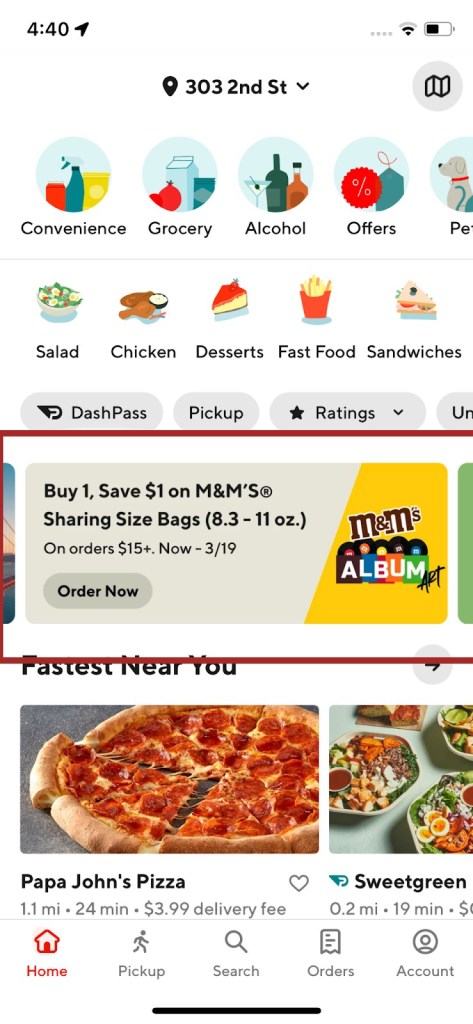
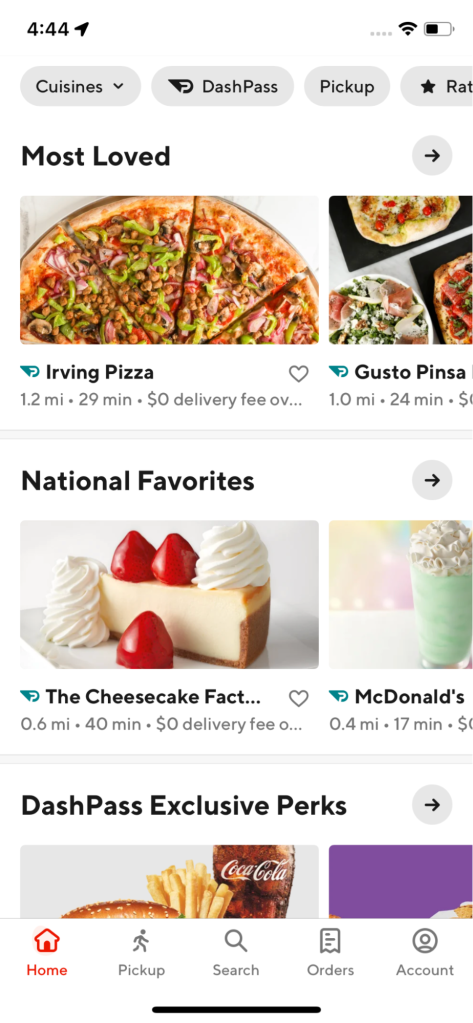
Banners - These are discovery units represented by a creative with some content that could appear on any page within the app. Examples of banners in the app are shown in Figure 1 and Figure 2. They are usually used to merchandise stores/businesses/deals or to inform consumers about an event. We typically show multiple of them as a horizontally scrollable unit. Each of them could be clickable and lead to a carousel, specific store, webpage, etc.
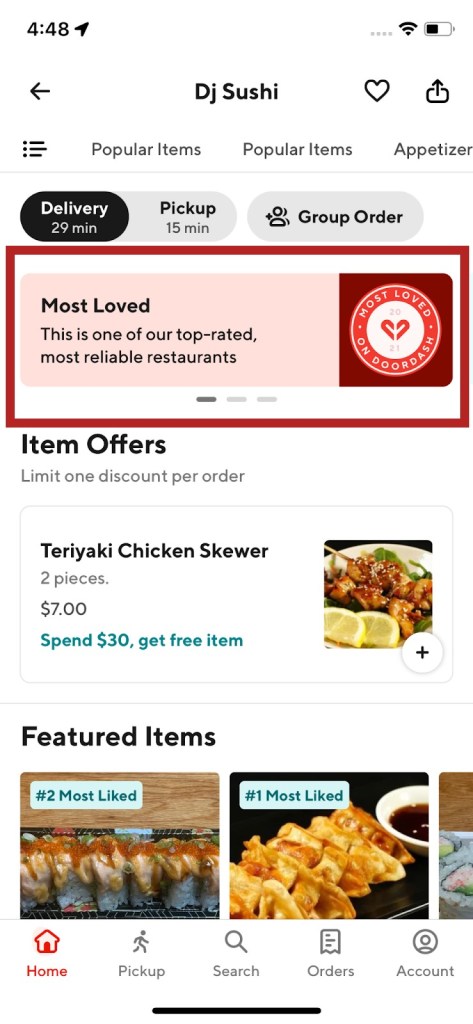
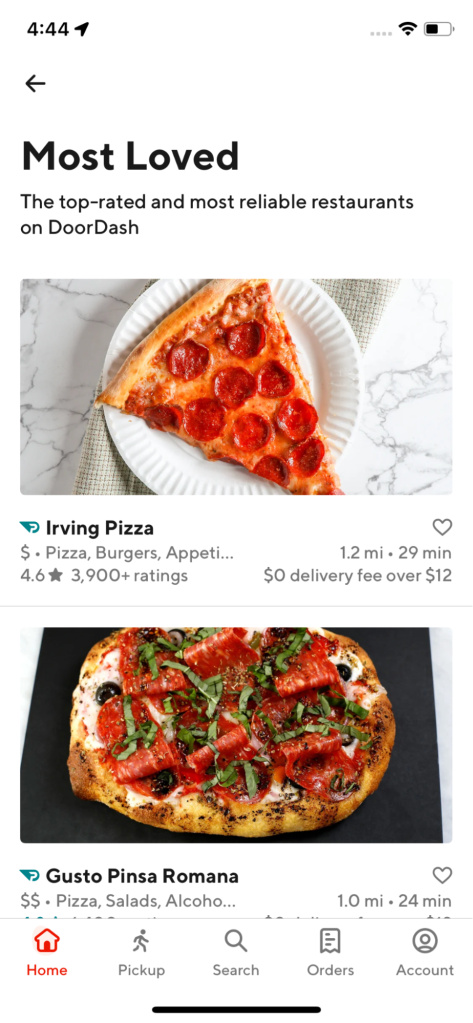
Carousels - These are discovery units that could appear on any page within the app. They are usually used to group stores into a common theme/category so that consumers are able to discover content in a more organized way. The stores inside these units are horizontally scrollable. On clicking the gray arrow, a broader selection of the stores belonging to this theme is shown. Examples of carousels in the app are shown in Figure 3 and Figure 4.
The challenge of fetching relevant content at scale
The challenge we faced was that too many discovery units had to be fetched in real-time which could be relevant for a consumer address’ deliverable radius. This scaling challenge was causing a huge toll on the availability and reliability of carousels.
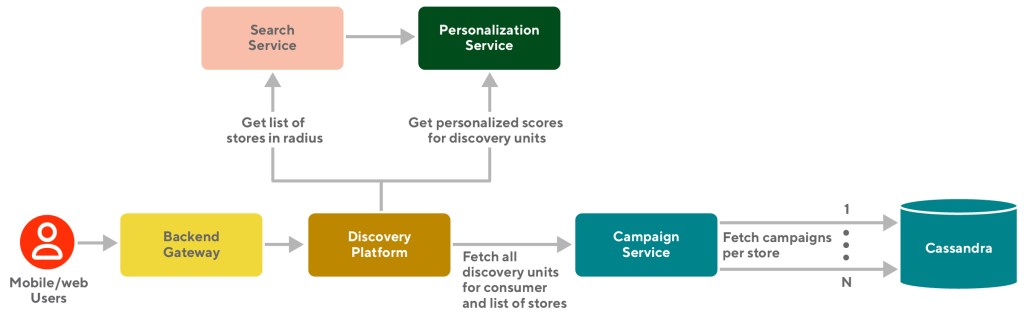
When using DoorDash the user experience starts the second you open the consumer app. On our backend systems, a lot starts happening immediately. One of the first things that happens is the set of stores (includes restaurants, grocery stores, pet stores, and so on) that are in the consumer address’ deliverable radius are fetched from search service which has business logic to determine what stores are relevant for customers given the logistical and geographical constraints. The number of stores available in a dense location like LA or NYC could easily reach thousands compared to hundreds in suburban areas.
Once relevant context like store data, consumer data, geographical information (like lat/long, city, district), etc. is calculated, a call is made from the Discovery system to the Campaign system to get a list of carousels and banners eligible, available, and relevant for the context that was passed along.
The Discovery system is responsible for content gathering, grouping and ranking of different entities for a given surface such as the home page.
The Campaign system internally tries to fetch campaigns for each store in the context to maximize recall.
How our Campaign system works
Our banner and carousel system relies on campaign objects, which are containers that hold configuration rules such as:
- what to show
- who to show to
- when to show
- how to show
These objects are configured at the store/business or a higher-order geographical level such as city, district, country, etc. Here, an example of a store could be the Safeway at 303 2nd St in San Francisco. A business is a bigger entity than a store that could have a list of stores belonging to it; for example, McDonalds could have 10,000+ stores.
The campaign system gives DoorDash strategy operators a very powerful way to be able to control the discovery surface content. Today we have banners and carousels that are manually curated, machine learning curated, and rule-based curated. All of them can be highly targeted to a set of users, shown during certain times of the day, have discounts associated with them, capped on how often they could show during a given time period, displayed at different start and end dates, and so on.
A single campaign could be targeting thousands of stores and each store in turn could have its own specific targeting, for example, a consumer needs to be new to the store to be eligible for the campaign.
Below is a demonstration of a simple campaign configuration that targets a store with store id = 999 to show a banner on the store page, and has specific start dates and end dates that it should show, and is only visible on the DoorDash app.
{
  "campaign": {
    "limitations": [
      {
        "type": "LIMITATION_TYPE_IS_ACTIVE",
        "is_active": {
          "value": true
        },
        "value": "is_active"
      },
      {
        "type": "LIMITATION_TYPE_EXPERIENCE",
        "experiences": {
          "experience": [
            "DOORDASH"
          ]
        },
        "value": "experiences"
      },
      {
        "type": "LIMITATION_TYPE_ACTIVE_DATES",
        "active_dates": {
          "start_time": {
            "seconds": "1613635200",
            "nanos": 0
          },
          "end_time": {
            "seconds": "1672559940",
            "nanos": 0
          }
        },
        "value": "active_dates"
      }
    ],
    "placements": [
      {
        "limitations": [
          {
            "type": "LIMITATION_TYPE_IS_ACTIVE",
            "is_active": {
              "value": true
            },
            "value": "is_active"
          }
        ],
        "type": "PLACEMENT_TYPE_STORE_PAGE_BANNER",
        "content_id": {
          "value": "most-loved-2022-store"
        },
        "sort_order": {
          "value": 5
        },
        "experiment_name": {
          "value": "testMostLoved2022"
        }
      }
    ],
    "memberships": [
      {
        "ids": [
          "9999999"
        ],
        "limitations": [],
        "user_criteria": [],
        "type": "MEMBERSHIP_ENTITY_TYPE_STORE"
      }
    ],
    "user_criteria": [],
    "id": {
      "value": "35145320-69bc-45cd-bb89-fc721b94a21d"
    },
    "name": {
      "value": "Campaign - BNY - Most Loved (Feb 2021)"
    },
    "description": {
      "value": "Most Loved tile - February refresh"
    },
    "created_by": "ujjwal.gulecha@doordash.com",
    "created_at": {
      "seconds": "1613690199",
      "nanos": 0
    }
  }
}
Explaining the fan-out problem
For dense locations like Los Angeles, a single request would fan out to thousands of calls to our internal systems. During peak traffic, we would easily reach millions of queries per second to our database systems. This volume is particularly bad because it puts a lot of load on all our microservice systems involved such as BFFs, service apps, and database systems. We had to massively horizontally scale all of our systems to meet this demand. As the number of stores and campaigns are increasing at a rapid pace to highlight content, it becomes harder to support everything at such a scale.
Our approach to tame the Fan out problem
So to summarize, there was a massive fan-out problem that kept growing and we were not sure how to proceed with it. We came up with a few solutions that we attempted to try to tame this problem.
Batching
The most obvious attempt to reduce the load on the application server sides was to batch the calls. We started experimenting with batching the calls to send X stores simultaneously, instead of all at once
After doing some performance testing, we empirically derived the optimal
batch size that worked for us. However, we soon started seeing that even this approach was ultimately not able to support our ever-growing expansion, selection, and discovery content. We could theoretically horizontally scale all our systems to support this, however that had its own challenges and we felt that was not the best use of our resources, nor was it sustainable in the longer term.
The four factors that did not allow us to support this in the long run can be summarized by this fan-out formula:
T * V * S * C (Traffic * Verticals * Stores * Campaigns)
- Traffic - Expansion into more geographical areas: this means more incoming traffic to our systems
- Verticals - Expansion into new verticals apart from restaurants, such as grocery, convenience, pet supply, etc
- Stores - Onboarding of more stores into the DoorDash system
- Campaigns - Explosion in the number of campaigns to merchandise stores
Researching geographical based grouping
Going back to the original problem, we were able to alleviate the load on application pods, but still had a load on our database systems. We had to research how to alleviate the load on our database systems.
As we began thinking more about this problem, one thing became clear to us: we need to reduce the cardinality of this fan-out. We needed a way to not request so many stores at a time but also not reduce the selection of stores; a way to group these stores which reduced this fan-out while fetching. Grouping stores by their geographical location made the most sense specifically in dense areas where you have lots of stores packed in a small area and then choose the best campaigns in those areas.
We looked into multiple existing solutions that would help us achieve this in a consistent, reliant, and scalable way. We looked at systems such as S2, Geohash, and H3
We did some testing, and based on empirical evidence, we chose H3 over other libraries. Here we outline some of the reasons that we thought H3 was a better fit.
H3 is Open source
H3 is an open-source project and is maintained by an active community with a wide list of high traffic production use cases. It is used by other technology companies, libraries like geojson2H3, and applications like kepler.gl.
High Availability and reliability
The API is simple, fast, and available in the languages DoorDash uses most frequently.
Relevance to DoorDash use case
H3 uses a hexagonal system which makes it easier to roughly approximate it to a circle which is closer to what DoorDash uses for calculating delivery radii. We compared the APIs and tested circle filling between S2 and H3 in our use cases. We found that H3 fits our use cases better and both S2 and H3 performed similarly in computational complexities. We would need to make geometric approximation work on top of geohash while H3 and S2 are both mature out of the box full solutions with good performance.
How we used H3 for our fan out solution
We could use the H3 library to visualize the world into different hexagons. There are different resolutions 1-15 that allow us to geographically condense stores into a large entity.
This solution allowed us to organize geo’s by hex’s instead of stores or what we were using before. We could now call hexes instead of individual stores and fetch the best campaigns for each hex thereby reducing cardinality.
Then the question arose: what size hexagon should we use? We wanted to run some benchmark tests to see what the best fit was for our situation. We did real-time analysis for proof of concept and were able to reduce the fan-out by a factor of 500x for non-dense areas and roughly 200x for dense areas.
We found that we reached the empirical optimal balance between computational complexity and approximation effectiveness at H3 resolution level of 9.
Once we finalized on using geo-hashes as our geographical filter for campaigns, we started looking at other ways of optimizing our fetching. Formerly we were fetching all campaigns and doing in-memory eligibility/filtering. This meant that the amount of data we fetched online was large.
We saw room for optimization if we could reduce the amount of data fetched by filtering closer to the storage layer. Essentially we wanted to move from “fetch all and filter in-memory” to “fetch filtered data”. This optimization was challenging to do with our existing non-relational database Cassandra which is great for fast lookups but not filtering on multiple keys.
Using Elasticsearch to filter data retrieval
Based on existing technologies at DoorDash, to optimize for filtering at data retrieval layer, we chose to go with Elasticsearch as this seemed a good fit for filtering at a data retrieval layer at high scale. This index contained campaign data which was denormalized in a way for efficient filtering and retrieval based on request context such as the geohash, start/end date, time of day and so on.
Why Elasticsearch
Elasticsearch is a search engine based on the Lucene library. It provides a distributed, multitenant-capable efficient data retrieval system. We selected it for the following reasons:
Needle in a haystack
Elasticsearch was great for needle-in-a-haystack queries where we would want to filter out and retrieve a smaller amount of campaigns compared to the total data-set. We calculated that we could reduce fetching for ~50% of campaigns if we could filter them at the data-retrieval layer.
Boosting/Ranking
Elasticsearch has in-built support for boosting search results in case we want to prefer some campaigns over others while fetching. There could be cases where we manually would want to fetch certain campaigns over others due to any business logic reasons, elasticsearch provided an easy way to achieve this
Scalability
We knew with our growth, we would need a system that could easily scale by simply adding more servers. Elasticsearch is highly horizontally scalable
Multi-tenancy
We wanted to ensure we can use a system that can be extended for other use cases if needed. Elasticsearch can support our needs by allowing multiple indexes to be created, each having its own configurations
Support
It was widely being used already at DoorDash. This meant we would have expert support in case we ran into issues
Results
We were able to massively reduce our operational costs while still maintaining high reliability and quality. In particular we were able to reduce ~50% costs for our Cassandra and Redis clusters and around 75% costs on our Kubernetes application hosting costs.
Things to explore
DoorDash is constantly evolving and expanding every single day. We believe this system has helped us serve our needs at this rapid growth pace, however we believe this is not the final solution. With DoorDash going into more countries internationally, expanding into other verticals, acquiring more consumers, and adding more stores to its platform, we will continue investing and iteratively improving our platform. Some ideas we are considering include, but are not limited to:
- Hierarchical H3 geo-hashes.
- Using dynamic Hexagon resolution levels instead of a static one based on market density. Benefits might include a more optimized way of fetching depending on density. Egg.: a dense location like NYC could use fewer hexes to represent it as it is super dense compared to a not dense location like Alaska.
- Using a tiered storage system for data retrieval - offline for long term data and online for real time data.
- Based on the above formula of the fan-out: T * V * S * C (Traffic * Verticals * Stores * Campaigns), optimizing the fetching of relevant but smaller sets of stores and campaigns. Using a first-pass ranker to reduce the candidates of stores and/or campaigns to evaluate could help alleviate issues. E.g.: For a dense location like SF, instead of fetching thousands of campaigns online, we could use a smaller but more relevant subset using relevancy scores between users and campaigns.
Acknowledgements
Thank you to Grace Chin, Chao Li, Fahd Ahmed, Jacob Greenleaf, Jennifer Be, Yichen Qiu, Shaohua Zhou, Shahrooz Ansari and Sonic Wang for their involvement and contribution to this project