Nov 20, 2016 · 5 min read
using logback Logstash SocketAppender.
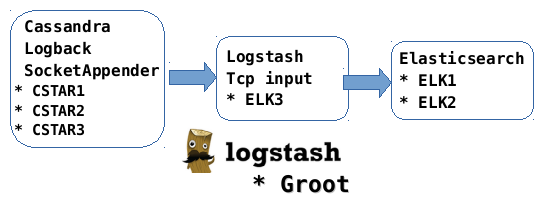
In this first post about monitoring Cassandra with Elasticsearch, we will see how to send Cassandra logs into an Elasticsearch cluster.
The ELK stack (Elasticsearch Logstash and Kibana) is very good at log management and a great help for log inspection. Since there is a logback backend in Cassandra since 2.x version, we will use the logback Logstash Appender to push the logs of a Cassandra cluster in an Elasticsearch index.
Note: The best practice would be to use the “beats” forwarders available since version 5 to push log files, since they are much lighter than logstash forwarders and than a jvm based process, but the present solution is still worth to know when not applicable.
Our Cassandra cluster is made of 3 nodes called cstar1, cstar2 and cstar3, each on an ubuntu server 14.04 virtual machines.
The Elasticsearch cluster we will use for logs is made of 2 VM nodes called elk1, elk2 each one running under ubuntu server 14.04 and hosting an elasticsearch instance. In addition, the elk1 VM will host the kibana server.
A third node, elk3 will host only the logstash “collector” process running under user groot.
Note: Elasticsearch can be run locally, on one node or as a cluster on several nodes and you can set up your elasticsearch installation as you want, the details are given here only to understand the configuration files.
The Cassandra log files appender installation process is given by the following steps:
- Upgrade/install the cassandra logback jars and logstash appenders of our Cassandra nodes
- Setup a minimal mappings template for the Elastic search index
- Setup a Logstash process (on ELK3 VM in our case)
- Setup the logback.xml configuration file on each of our Cassandra nodes
After that we will be able to use Kibana to inspect our Cassandra cluster logs
The logstash-logback-appender is not included in the default Cassandra distribution, and we will have to download it an copy the jar file in the lib directory of our cassandra installation, along with an upgrade of the logback version : the 1.1.3 version of logback included in Cassandra 3.10 does not support this appender, it has to be upgraded to 1.1.6.
Get the jars
The jar files for logback can be found on maven here.
Logstash logback socket appender too
The following dependencies must also be downloaded: disruptor-3.3.4.jar, jackson-annotations-2.6.0.jar, jackson-core-2.6.5.jar, jackson-databinding-2.6.5.jar . They can be found on Maven repository too.
or you can download the maven project and build it with your favorite ide or maven command line, this will download dependencies.
Copy the jar files to your Cassandra installation
Example of copy with ssh enabled between VMs (one line rcp copy with user cstar)
for node in cstar1 cstar2 cstar3 ; do for file in logstash-logback-encoder-4.9-SNAPSHOT.jar jackson-databind-2.6.5.jar jackson-core-2.6.5.jar jackson-annotations-2.6.0.jar disruptor-3.3.4.jar ; do rcp lib/$file cstar@$node:apache-cassandra-3.10-SNAPSHOT/lib ; done ; done
The mapping given here is very basic, it only define one non analyzed field (HOSTNAME), other fields will be created as is by logstash and elasticsearch default mappings.
For a production logging solution, it would require much more work, this is a basic setup.
PUT /_template/logs_1
{
"template": "logs*",
"settings": {
"index.refresh_interval": "5s",
"index.codec": "best_compression"
},
"mappings": {
"log": {
"properties": {
"HOSTNAME": {
"index": "not_analyzed",
"type": "string"
}
}
}
}
}
This template mappings is applied in the elasticsearch ‘sense’ console, not by the logstash process.
Setup the process
On VM ELK2, under user groot (in our case), the following logstash script will be saved in a file named cstar-logstash.conf in groot home directory.
input {
tcp {
port => 4560
codec => json_lines
}
}
output {
# stdout {}
elasticsearch {
hosts => ["elk1:9200","elk2:9200"]
index => "logs-cstar-%{+YYYY.MM}"
#flush_size => 10000
codec => "json"
}
}
Notice the line
index => “logs-cstar-%{+YYYY.MM}”The index name used in elasticsearch contains the “origin” (cassandra cstar cluster) plus a date pattern, in order to spread shards and ease cleanups and maintenance.
Start as a service
This logstash script can be automatically started on system reboot with the ubuntu upstart following script :
description "logstash 2.3.4 process"
author "alain rastoul"start on runlevel [2345]
stop on runlevel [016]setuid groot
setgid grootpre-start script
[ -d /home/ ] || exit 1
[ -d /home/groot/elastic/logstash-2.3.4 ] || exit 1
end scriptscript
/home/groot/elastic/logstash-2.3.4/bin/logstash -f /home/groot/cstar-logstash.conf
end scriptpost-start scriptend script
This script assumes that the user is ‘groot’, logstash installed in ‘/home/groot/elastic/logstash-2.3.4’ directory.
Copy this script in a file named /etc/init/logstash-234.conf and it will start on each system boot.
You can now also use sudo service logstash-234 start or sudo service logstash-234 stop to start and stop the logstash collector process.
We will add the following lines to declare the new logback appender in conf/logback.xml configuration file of each Cassandra node
<appender name="LOGSTASH" class="net.logstash.logback.appender.LogstashTcpSocketAppender">
<destination>elk3:4560</destination>
<encoder class="net.logstash.logback.encoder.LogstashEncoder"/>
</appender>
Note: Change the address of the logstash forwarder if necessary
And add a LOGSTASH reference to the appender
<root level="INFO">
<appender-ref ref="LOGSTASH" />
<appender-ref ref="SYSTEMLOG" />
<appender-ref ref="STDOUT" />
<appender-ref ref="ASYNCDEBUGLOG" /> <!-- Comment this line to disable debug.log -->
<!--
<appender-ref ref="LogbackMetrics" />
-->
</root>
A small taste of Kibana if you don’t know it… :)
After rebooting our Elasticsearch cluster, our Logstash collector and the Cassandra cluster , we should see logs coming into Elasticsearch.
This can be verified with a Sense ‘search command’
We will first define an index pattern for our queries in Kibana/Settings menu
We can now use it in “Discovery” queries
Or in Visualizations.
If you liked this post (what I hope),
then you can go to the next one about
Cassandra metrics and Elasticsearch.