Apache Cassandra is a distributed database known for its high availability, fault tolerance, and near-linear scaling. It was initially developed by Facebook, but it is a widely used open-source system used by the largest tech companies in the world. There are numerous reasons behind its popularity, including no single point of failure, exceptional horizontal scaling with a data layout designed as a perfect fit for time-series data.
However, despite these perks, like any other system, Cassandra is prone to performance issues. This makes monitoring imperative. And it all starts with knowing what to measure. In this article, we will explain the key Cassandra performance metrics you should monitor to make sure everything is up and running at all times.
What Is Cassandra and How Does It Work?
Let’s keep it short – Apache Cassandra is a distributed NoSQL database designed to provide fault-tolerant and highly available architecture with performance in mind.
As a distributed system Cassandra is built out of nodes. A node is a single instance of Apache Cassandra that can operate on its own. Multiple nodes can form a cluster – a distributed system holding common data and responding to query requests. Cassandra works in a master-less architecture where each node communicates in a peer to peer fashion using a protocol known as Gossip. The gossip protocol is designed so that each node is informed about the state of all other nodes and a single node performs gossip communication with up to three other nodes every second.
The cluster can be divided into data centers and racks, just like the real-life data centers are divided. In Cassandra terminology, a data center is designed to hold multiple racks and a single rack holds a complete replica of the data.

Cassandra Cluster Logical Overview
When it comes to the data, Cassandra stores it in tables that are organized the same way as in any other database – in rows and columns. A single table is called a column family. The tables themselves are grouped into keyspaces, where a keyspace usually holds logically similar data – for example, from a business perspective. The keyspace is also used for data replication, and the replication itself is configured on a keyspace level.
Getting back to the tables. Each table defines a primary key that is built of the partition key and the clustering columns. Cassandra uses the partition key to index the data. All data that share a common partition key make a single data partition – a basic unit for data retrieval and storage. The clustering columns are optional.
Needless to say, Apache Cassandra is a complicated, distributed system and it’s not uncommon for users to encounter operation problems and difficulties. Everything breaks eventually, from the low-level bare metal components, up to the high-level software. It is not unusual for users to deal with network issues and CPU utilization problems, especially on very large clusters. Cassandra is written in Java and uses both off-heap and heap memory, which means that as the volume of data grows, you may hit issues with the garbage collector. Finally, because of the amount of data that you will process you may need to deal with the hard disk space and performance of your I/O subsystem. All of these can be avoided by keeping an eye for the relevant metrics with the help of a good Cassandra monitoring tool.
How Is Cassandra Performance Measured?
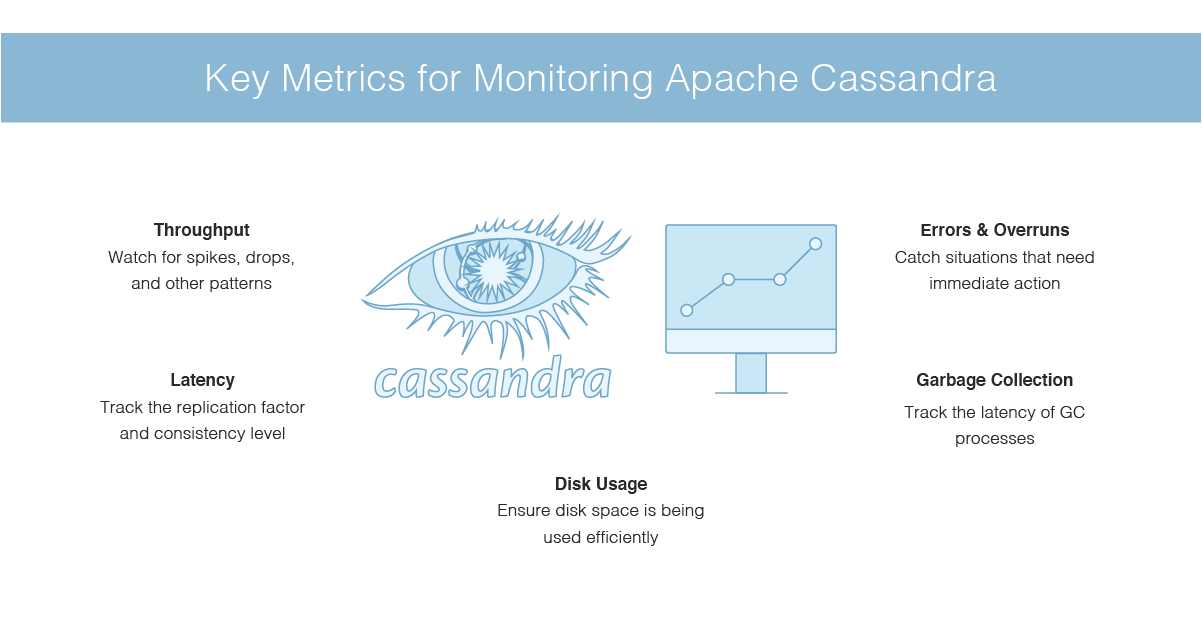
The most complex, distributed systems provide a set of metrics that you should take care of, monitor, and alert on to ensure that your system is healthy and working well. Apache Cassandra is no different. It provides a plethora of performance metrics which we can divide into three categories:
- Dedicated Apache Cassandra metrics that describe how the system and its parts perform.
- Java Virtual Machine metrics that tell you about the execution environment on which Apache Cassandra is running.
- Operating system metrics describing the metrics related to the bare metal servers, virtual machines, or containers, depending on the environment that you are using.
Dedicated Cassandra Performance Metrics
When monitoring Apache Cassandra clusters, is the metrics that the distributed data store exposes via the JMX interface. There are many Cassandra performance metrics exposed in the JMX and having visibility into most of them is a good idea. You never know what can be useful when troubleshooting.
Nodes
One of the most important Cassandra metrics is the number of nodes that are currently available and connected to form a cluster. The ability to store the data and respond to queries is directly related to the availability of nodes.
Compaction Metrics
Compaction is the operation of merging multiple smaller instances of SSTable into one bigger SSTable that contains all the data from the smaller tables. Because of that, it can be very expensive and resource-consuming. Having visibility into compaction performance is critical for long-term observability – the Cassandra monitoring tool of your choice needs to provide the number of compactions and the number of compacted bytes.
During compaction, until the process ends, the total disk space used may be double that before the compaction. Because of that, you should consider leaving about 50% of space free to account for compactions and, of course, set up appropriate alerts to inform you when the amount of free disk space is close to a level where compaction could fail.
Read and Write Performance Metrics
The next set of metrics is dedicated to clients and the read and write side of the operations. You should measure the number of reads happening in a given period, the request latency, and the number of timeouts and failures. Your Cassandra monitoring tool should provide the top-level view and allow for slicing and dicing through the data showing you the aggregated view, per node view, per keyspace view, and per table view. The same goes for write operations.
You should see the number of write requests happening and write latency. Local writes and reads may also be important when troubleshooting.
Table Metrics
Table metrics are also essential. The ones you should pay close attention to are partition size, tombstone scans, and the number of SSTables per read.
Partition Size
Partition size is crucial for cluster performance. Cassandra uses it as a unit of data storage, replication, and retrieval, thus directly dictating the performance of your Cassandra tables. The ideal partition size varies but is usually below 100MB and not less than 10 – 20MB.
Tombstones
Cassandra produces tombstones when you delete the data. They are markers of the deleted data. Data in Cassandra is immutable by design, and because of that, it can only be physically removed from the SSTable during compactions. Because of that, you should keep an eye on how they affect your disk space.
SSTables Per Read
Similar to tombstones, the number of SSTables per read is related to the immutability of the data in Cassandra. A single table can be built of multiple SSTables, which are written sequentially. A single read operation can result in reading multiple SSTables to retrieve the relevant data. The more SSTables Cassandra needs to read to return the data, the more resources are required to complete the read operation. This is why you should minimize the number whenever possible.
Other Metrics
As we mentioned earlier, other Apache Cassandra performance metrics can be helpful and you should consider monitoring them.
Caches
There are two types of caches in Cassandra – the key cache and the row cache. Cassandra uses the key cache to store the location of row keys in memory so that the rows can be accessed without the need to hit the disk. The row cache stores the rows themselves in memory. By using the caches, Cassandra reduces the need to read the data from the disk and trades the memory usage for performance.
You need to monitor the key cache requests and row cache requests, which tell how many requests to a given cache type were made, and the key cache hit ratio and the row cache hit ratio, which show the percentage of results retrieved from the cache instead of the disk.
Threadpool
Cassandra is designed to handle the high load, withstand backpressure, and perform asynchronous tasks. Monitoring various thread pools is crucial for understanding Cassandra’s performance and bottlenecks. Each thread pool exposes the number of active, pending, and blocked tasks. Accumulated, pending, and blocked tasks usually tell about performance issues and the need for more processing power or different data and query architecture.
Bloom Filter
In the read path, Cassandra merges the data stored on a disk inside the SSTables with the data stored in memory. To minimize the amount of checking for data existence in the SSTables on the disk Cassandra uses a data structure called bloom filter.
The bloom filter is a probabilistic data structure that can tell Cassandra that the data is definitely not in a given file or that the data may be present in a given file. The key metrics to monitor here are the amount of space used by bloom filters, the number of false positives, and the ratio. You can reduce the number of false positives by assigning more memory to the bloom filters.
Java Virtual Machine Metrics
Apache Cassandra is a JVM-based application that comes with all the usual JVM pros and cons. From the developer’s perspective, memory management is easier and requires less hassle – you just use an object and forget about it, letting the JVM do the cleaning up. But that means that something has to clean up all the unused objects in memory. This is where the Java Garbage Collection comes in and the metrics that come with it.
A proper Cassandra monitoring tool should provide metrics that allow you to check and troubleshoot issues with the Java Virtual Machine, such as JVM memory utilization and garbage collection count and time. You can read more about them in our guide about JVM metrics.
Operating System Metrics
You can’t ignore Operating System metrics either. Information such as CPU utilization, memory usage, and disk usage is essential and can play a major role when it comes to Cassandra performance.
CPU Utilization
Your CPU is used for data processing and query handling. The more spare CPU cycles you have on a given node, the data and queries it can process. The user part of the CPU usage will show you your Cassandra process needs, while the wait can point to a bottleneck in I/O or network. As with every Java application, CPU cycles are also needed for garbage collection, so keep that in mind when planning.
Memory Usage
Memory usage is crucial for every JVM-based application. The newest version of Cassandra leverages both off-heap and heap memory. This means that you not only need to set the heap size of your Cassandra nodes correctly but also have enough off-heap memory for keeping your cluster performance at its best.
Disk Usage
Disk and I/O are crucial – Cassandra keeps its data on the disk, and each query may require a substantial number of I/O operations to return the results. You need to be sure that your hardware can handle your data retrieval needs. You also need to be sure that you have enough space to hold your data and handle the compaction process.
Monitor Cassandra Performance with Sematext
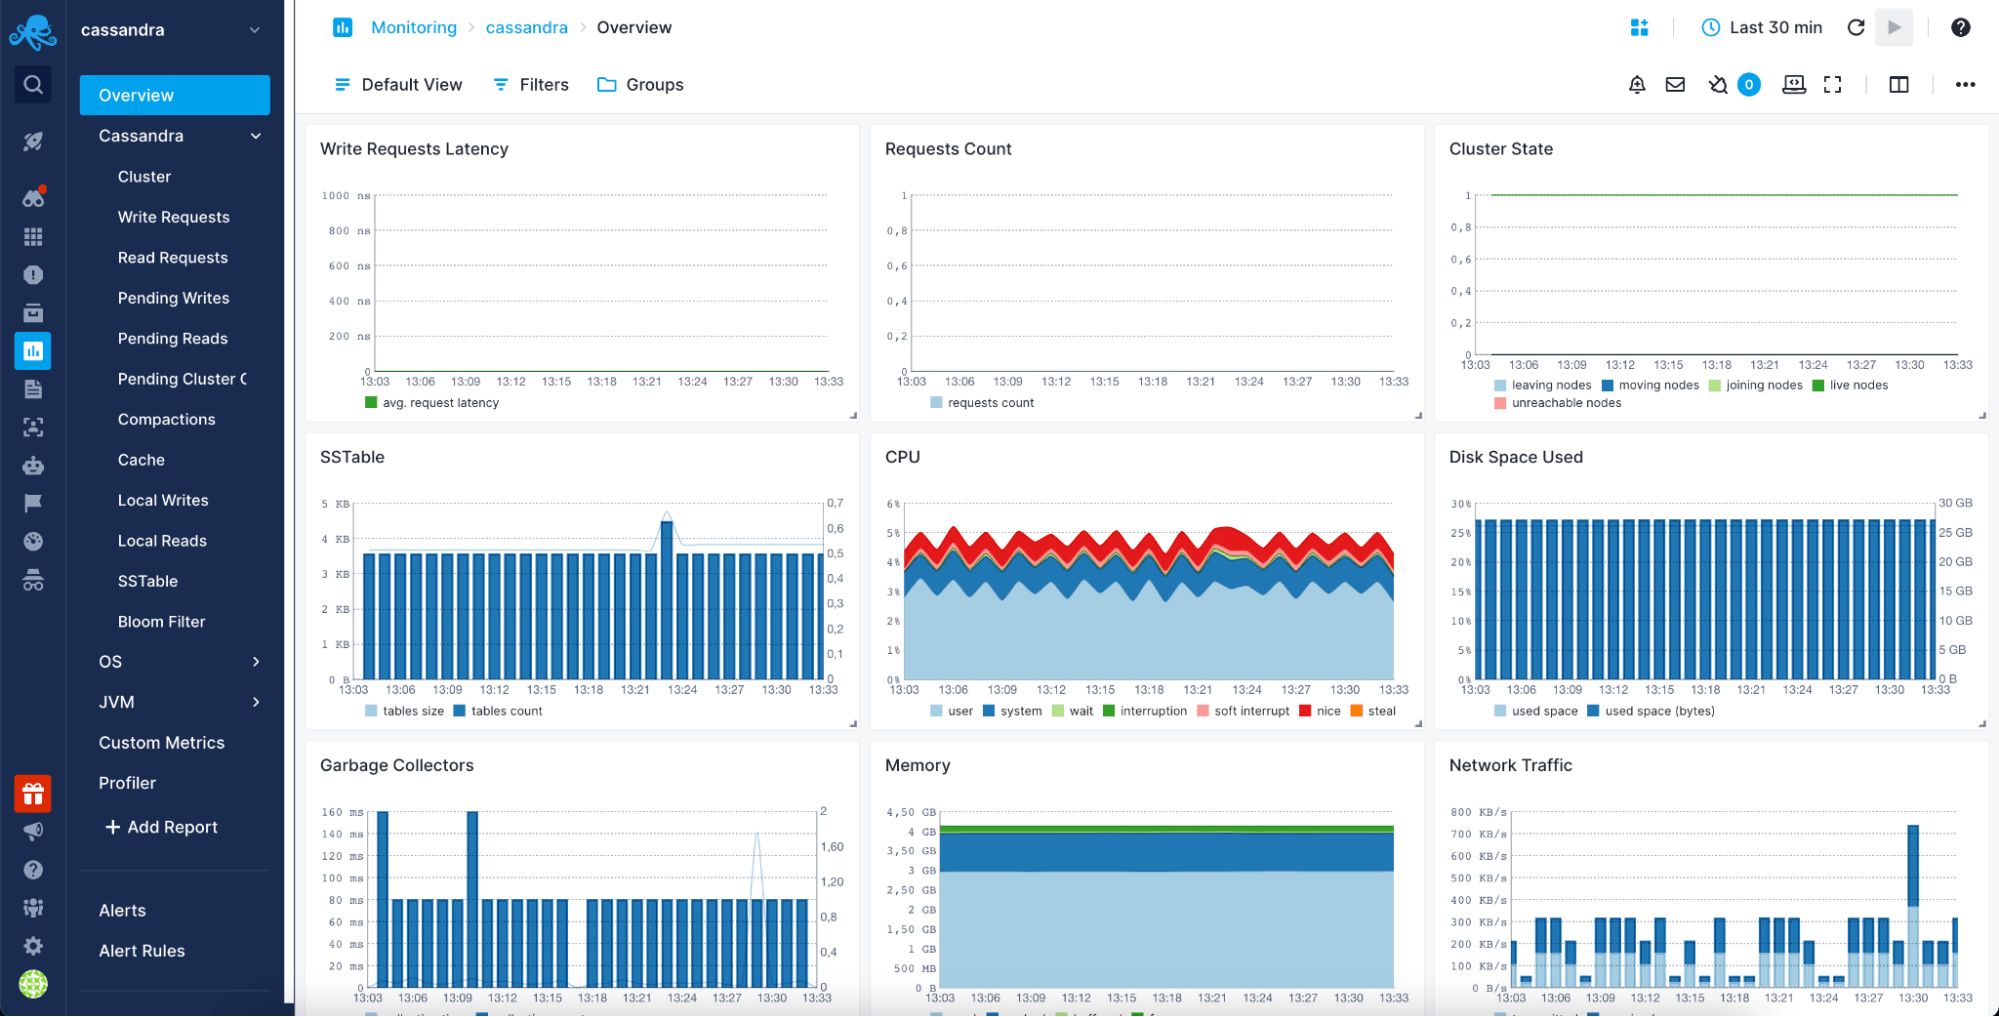
Sematext Cloud and its Apache Cassandra monitoring integration provide all that you need to monitor your distributed database. Everything is within a single view available without distractions:
- The overview report gives you a perfect start point for your metrics, painting a picture of the whole cluster.
- A dedicated Cassandra report that provides an in-depth view of all relevant metrics related to the distributed database.
- The OS report provides necessary operating system metrics such as CPU and memory utilization and visibility into your network traffic.
- Finally, the JVM metrics give the full view of the Java Virtual Machine, such as metrics related to garbage collection and per-heap space memory utilization.
Using the dedicated split-view, you can correlate all the available metrics with other metrics, logs, and real user monitoring data, making Sematext a perfect visibility tool.
Sematext allows you to set up alerts on any metric or log the event and supports both threshold-based and anomaly-based alerts for full flexibility. You don’t have to watch your metrics over and over. Once you configure your alerts, you can sleep well, and Sematext will let you know if something is wrong.
If you want to see how Sematext stacks against similar solutions, read our article about the best Cassandra monitoring tools available today.
Get Started with Cassandra Monitoring
As the distributed database Apache Cassandra can quickly become an operational challenge without visibility into what is happening from a global perspective as well as on a node level. You need to have full visibility from top to bottom, but that is not enough. You need to be sure that your monitoring system can notify you when an issue happens and also predict issues before your customers notice them.
One of the tools that will give you all of that is Sematext’s Apache Cassandra monitoring integration. String monitoring your Cassandra cluster by creating the Sematext Cloud account and then the Cassandra monitoring App. Don’t forget to create a Logs App as well to ship you Cassandra logs for a full observability experience.