
What is Apache Cassandra?
Apache Cassandra is an open-source database management system. Apache Cassandra has been used by companies such as Apple, Spotify, Netflix, and Uber. The system is widely used because it is a fault-tolerant, scalable and decentralized database solution. Cassandra can be downloaded for free from the Apache website here.
Even though Cassandra comes with features like fault tolerance built-in, it still needs to be managed effectively. Using a network monitoring tool to measure the performance and health of databases is necessary to deliver the best performance and avoid security events.
There is lots of detail on the tools below, but for a quick summary, here is our list of the 8 best tools to monitor Apache Casandra:
- SolarWinds Server & Application Monitor (FREE TRIAL) Our top choice for Apache Cassandra monitoring. Great for monitoring Linux or Unix including nodes stats, tracking, and network health.
- Datadog Apache Cassandra Monitor (FREE TRIAL) An application performance monitor that covers database services and has great performance data visualizations.
- ManageEngine Applications Manager (FREE TRIAL) Also compatible with MongoDB, has a great dashboard that can monitor clusters and more.
- Dynatrace Automatically detects Apache Cassandra databases, can get into depth on the data it gathers.
- AppDynamics Also auto-detects Apache Cassandra databases and offers good monitoring and tracking options.
- SignalFx Similar to above options but is cloud-based. Good for setting alerts.
- Instaclustr Network monitor with a custom Cassandra monitoring API. Provides 20-second updates and a good cluster summary view.
- Instana This monitor is good at providing metrics right down to the node level.
The best tools for monitoring Apache Casandra
1. SolarWinds Server & Application Monitor (FREE TRIAL)
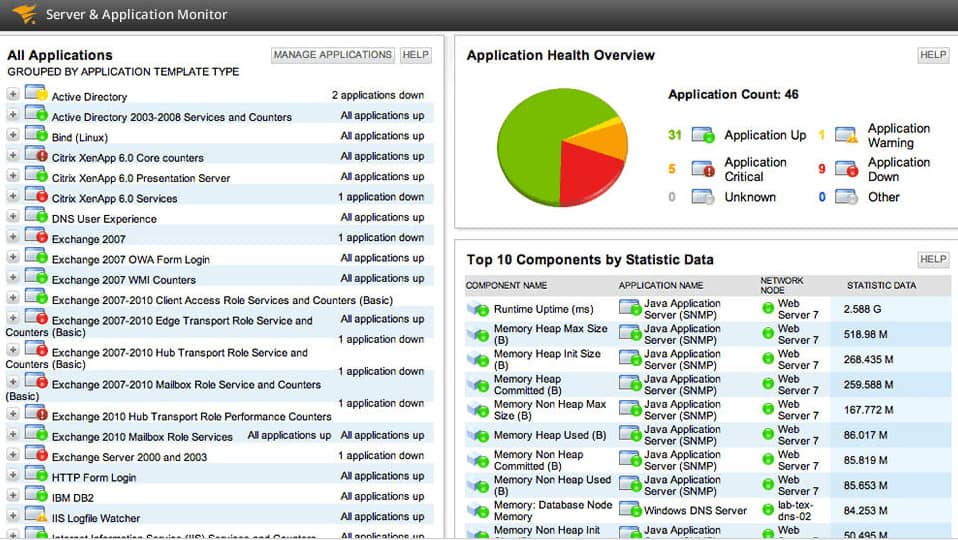
SolarWinds Server and Application Monitor is a network monitoring tool that can monitor Apache Cassandra. The tool has been designed to monitor the performance and availability of Apache Cassandra servers on Linux or Unix. Details on service health, node stats, and network tracking can all be viewed through one unified dashboard.
You can also set customized alerts on SolarWinds Server & Application Monitor. Factors monitored include increased latency or ongoing hint activity. Alerts can be viewed through the All Active Alerts page which tells you a list of all current alerts including the cause of the alert and how long it has been active.
As an Apache Cassandra monitoring solution, SolarWinds Server & Application Monitor is an excellent product on account of its alerts system and its versatile dashboard. SolarWinds Server & Application Monitor starts at $2,995 (£2,397). You can download a 30-day free trial.
SolarWinds Server & Application Monitor Download 30-day FREE Trial
2. Datadog Apache Cassandra Monitoring (FREE TRIAL)
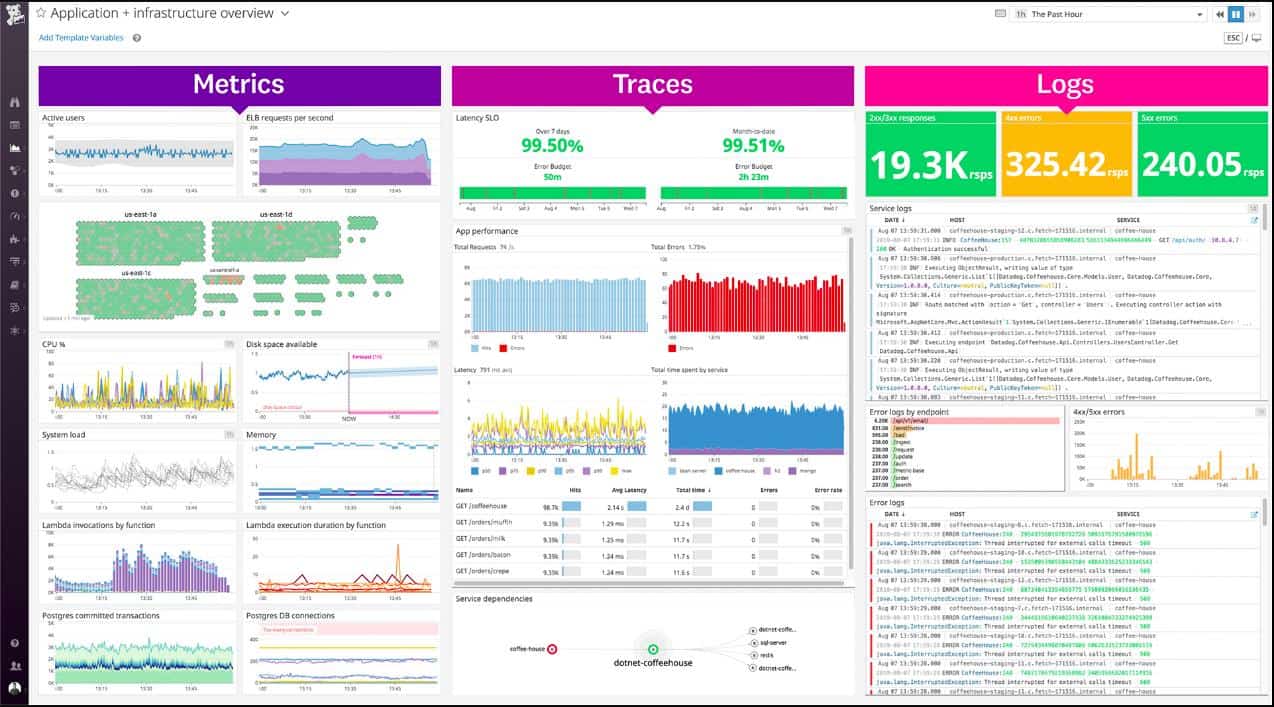
Datadog APM is a SaaS platform that covers a long list of applications, including Apache Cassandra and other RDBMSs. Datadog has a library of integrations, including those with Apache products, such as Apache Cassandra.
The screens of the dashboard are packed with information. If the standard screen seems too busy, you can create your own home page with the metrics that matter most to you. It is even possible to combine widgets from different pages, giving you a stack overview showing database, server, and network performance overviews all in one place.
It isn’t possible to watch all of the performance statuses of your database all of the time. However, this is not a problem because Datadog APM sets performance threshold levels on every metric and alerts you if one gets tripped. This service enables you to get on with other tasks rather than spending all of your time monitoring your Apache Cassandra databases.
Datadog is charged for by subscription and the entire platform is split into modules of monitors. You can add on Datadog Infrastructure to get deeper insights into your network hardware and server statuses and Network Performance has traffic flow analysis capabilities. All Datadog modules are available on 14-day free trials.
Datadog Apache Cassandra Monitoring Start 14-day FREE Trial
3. ManageEngine Applications Manager (FREE TRIAL)
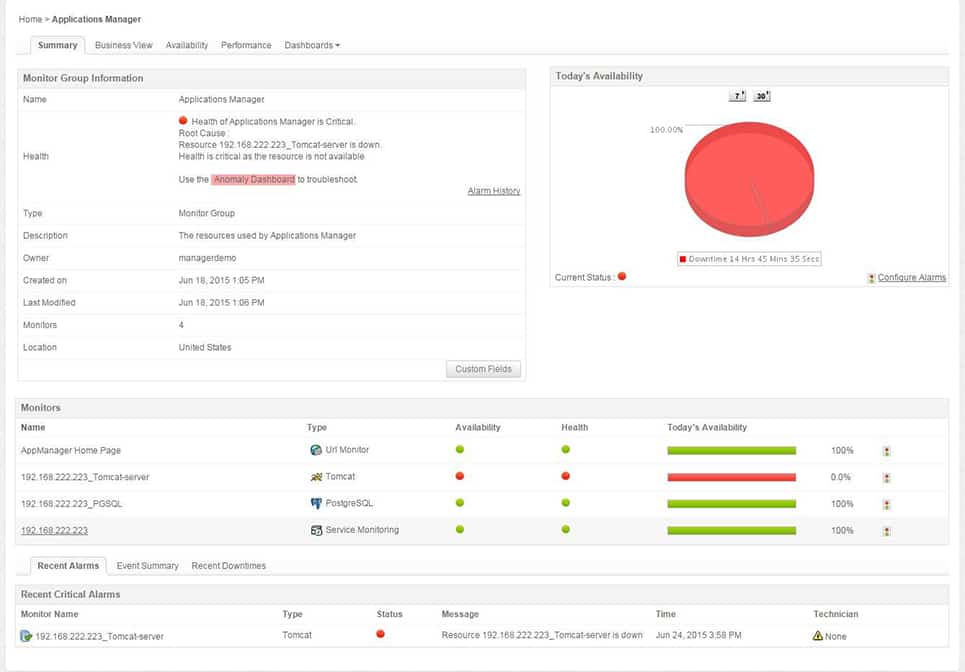
ManageEngine Applications Manager is an application monitoring tool that is compatible with Apache Cassandra and MongoDB. Performance metrics you can monitor with ManageEngine Applications Manager include CPU usage, operational performance, latency, pending tasks, and memory utilization. The dashboard has been designed specifically to help you monitor clusters, and breaks down the health status of individual clusters in a list format.
Beyond the dashboard, there are many different performance graphs that show you how Cassandra is performing. There are graphs for memory utilization, CPU usage, and storage statistics. For example, the memory utilization graph shows you how used memory, free memory, and total memory has changed over time.
There are three versions of ManageEngine Applications Manager: Free, Professional and Enterprise. The Free version supports up to five applications or servers free of charge. The Professional version starts at 25 monitors for $945 (£756) up to 250 monitors for $7,195 (£5,759).
The Enterprise version costs $9,595 (£7,680) for 250 monitors up to $83,995 (£67,238) for 5000 monitors. You can add additional monitors up to 10,000 monitors in total. You can download the 30-day free trial.
ManageEngine Applications Manager Download 30-day FREE Trial
4. Dynatrace
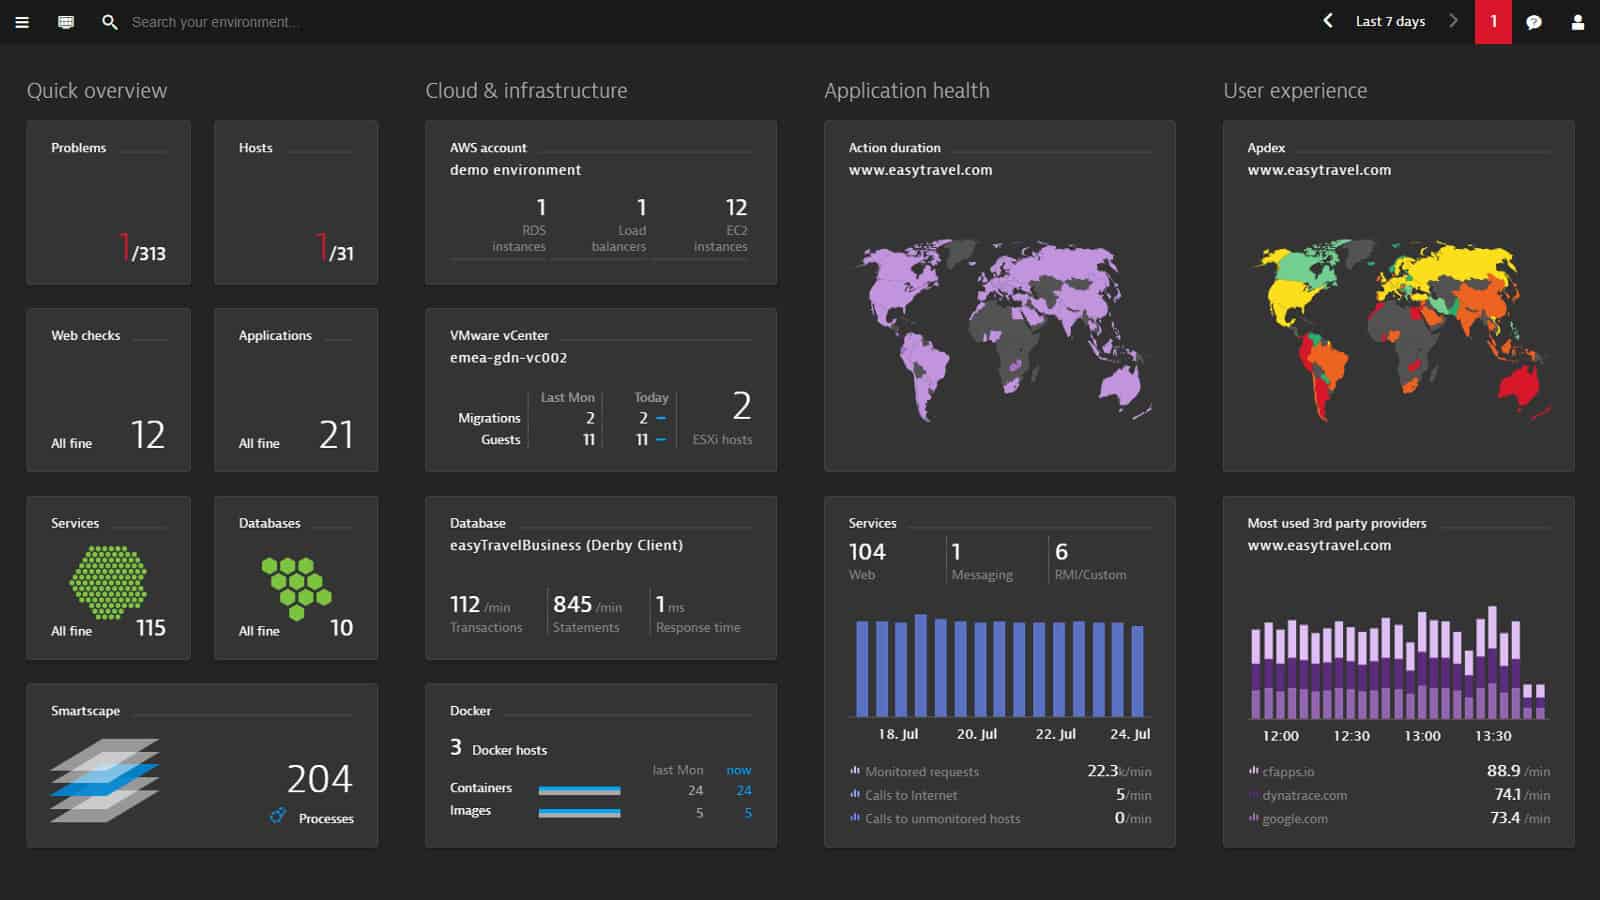
Dynatrace is an application performance monitoring tool that can monitor Apache Cassandra. Dynatrace automatically detects Cassandra databases in less than five minutes, so you can start monitoring their performance. Performance metrics you can monitor include CPU, connectivity, garbage collection time, suspension, and retransmissions. On the Further details tab, you can start looking at deeper statistics like disk usage, Cache, Hints, Load, Thread Pools, and Java Managed memory.
Root cause analysis is one of Dynatrace’s strongest features. Dynatrace will be able to highlight the root cause of performance issues on individual nodes. Automating root cause analysis allows you to respond to server problems much faster by having all the necessary information on hand to make an informed response.
If you require a Cassandra monitoring tool that is easy to configure and visibility that stretches right down to the node level then Dynatrace is a tool you should definitely consider. If you want to know the price of Dynatrace you’ll have to contact the company directly. There is also a 15-day free trial.
5. AppDynamics
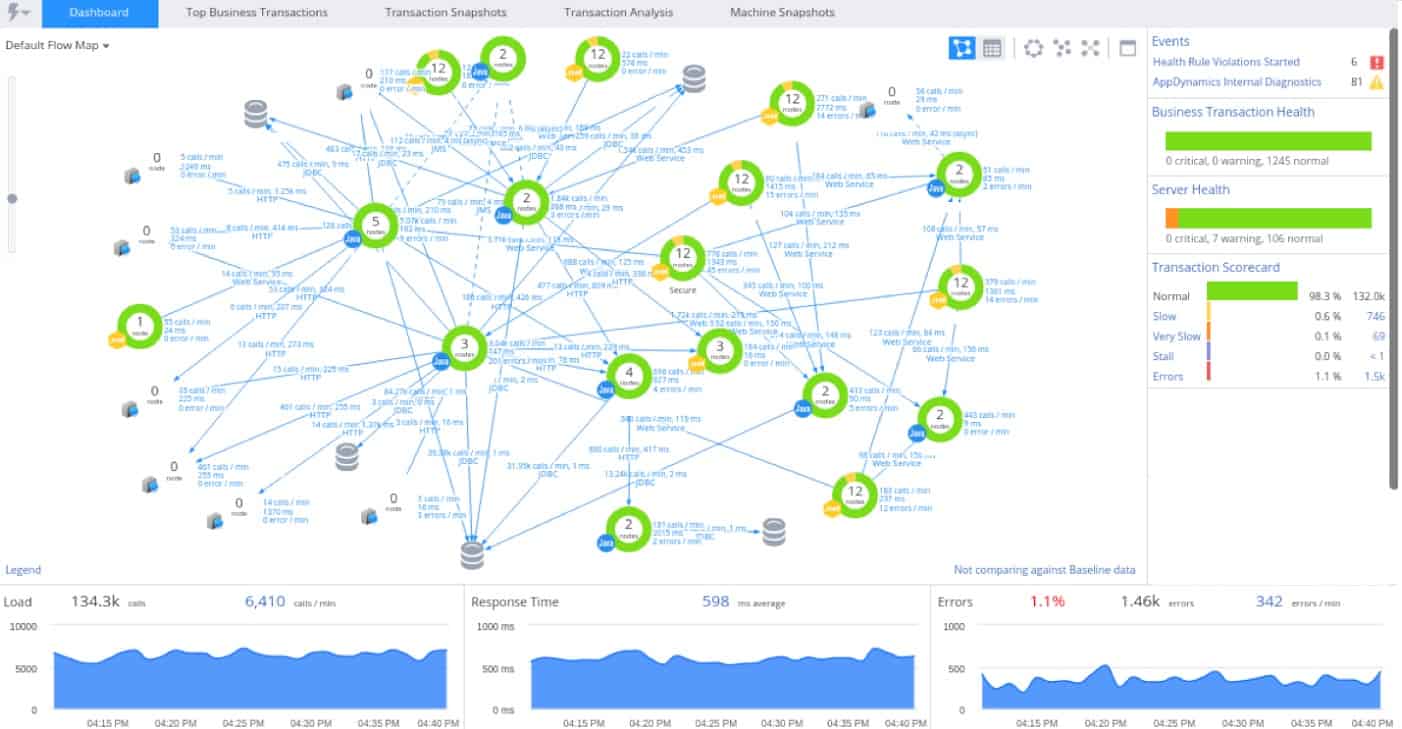
AppDynamics is another leading application management tool that can monitor Cassandra databases. With AppDynamics, you can see right down into the details of business transactions. The product automatically discovers Apache Cassandra databases and adds them to your monitoring environment.
There are many different metrics you can monitor with AppDynamics. For example, by monitoring Cassandra back-end communications you can capture data on average response time, errors per minute, and calls per minute. This information gives you an overview of how the service is performing.
There are three versions of AppDynamics available to purchase; APM Pro, APM Advanced, and APM Peak. APM Pro includes business transaction monitoring as a basic package but you need APM Advanced to make use of server visibility and network visibility as well.
APM Peak is the premium package which includes business performance monitoring, transaction analytics, and business journeys. In order to view the price of these packages, you will need to contact the sales team. You can download the 15-day free trial.
6. SignalFx
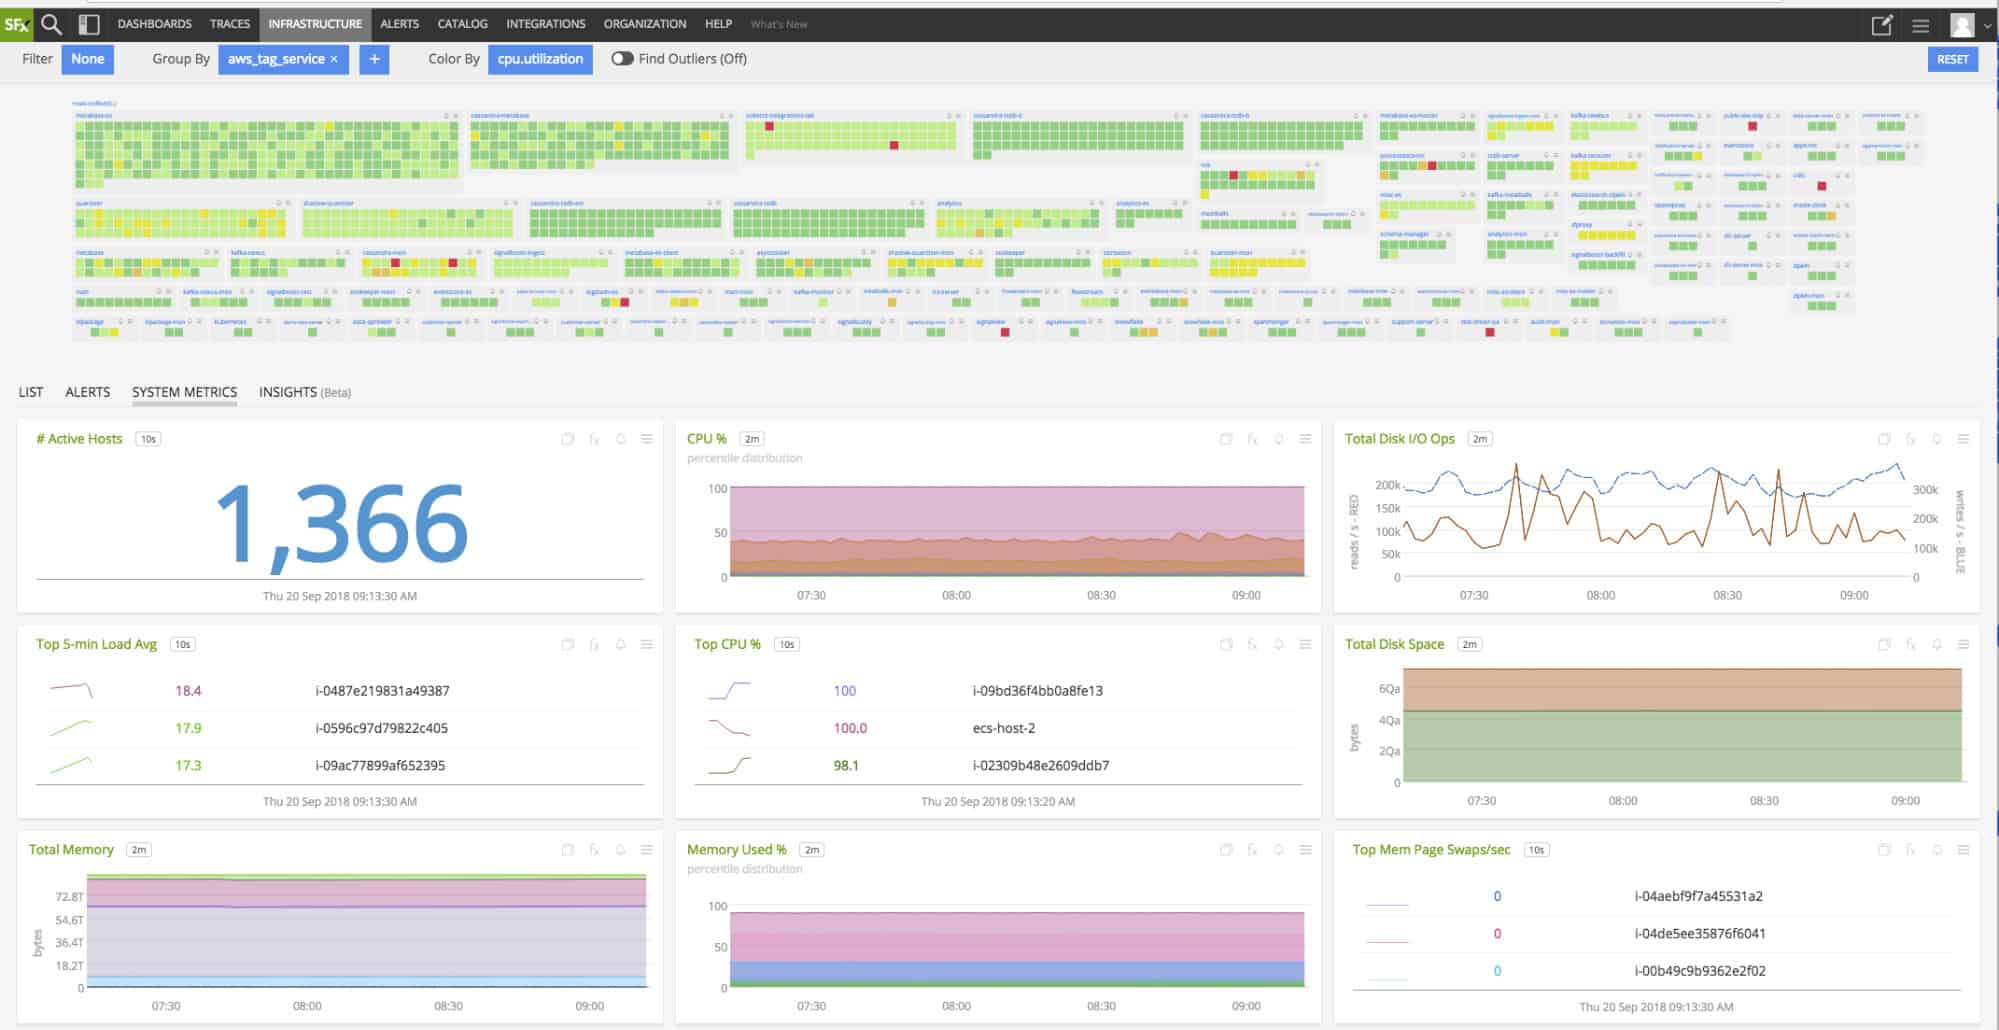
SignalFx is a cloud monitoring product designed for monitoring infrastructure like Cassandra. SignalFX uses collectd and JMX to collect performance data from Cassandra. Metrics you can monitor with this tool include latency, throughput requests, errors, compaction activity, and hint activity. All of this data can be viewed through monitoring dashboards.
You can also configure alert rules to determine what activity will trigger an alert. Alerts are categorized as Critical, Major, Minor, Warning, and Info. Alert rules can be managed in the Alerts view where you configure the Rule Name and Source, DetectName, and Duration. There is also the option to use real-time analytics to detect important usage trends (that could indicate other performance issues).
SignalFx is available in two versions; SignalFx Infrastructure Monitoring and SignalFx Microservices APM. SignalFx Infrastructure monitoring costs between $15 (£12) to $25 (£20) per host per month. SignalFx Microservices APM ranges from $45 (£36) to $65 (£52) per host per month. A free trial is available.
7. Instaclustr
Instaclustr is a network monitoring platform that has a Cassandra Monitoring API. The Cassandra Monitoring API monitors the disk utilization, CPU utilization, reads and writes, latency tasks, pending compactions, task statistics, live cells and tombstones per reading. Each metric is updated every 20 seconds so all the information you see is up to date. For an overhead perspective, the Cluster Summary view gives you enough information to ascertain the health of a cluster.
The visualization included with Instaclustr helps you to monitor the changes in metrics over time. For example, you can view a graph that shows you the fluctuations in ‘Read Latency’ over time. These graphs make it easy to identify trends that you might miss if you’re using the dashboard.
There are four versions of Instaclustr available to purchase: Developer – Starter, Developer – Professional, Production, and Enterprise. Developer – Starter costs $20 (£16) per node per month with a 5GB storage capacity and 2000 MB memory. The Professional version costs $79 (£63) per node per month for 30GB storage and 3750-4000 MB memory.
The Production version starts at $250 (£200) for 250-3200 GB of storage and 8000-122000 MB of memory. The Enterprise version starts at $2,500 (£2,000) and is aimed at companies looking to monitor over 30 nodes. You can download the free trial.
8. Instana
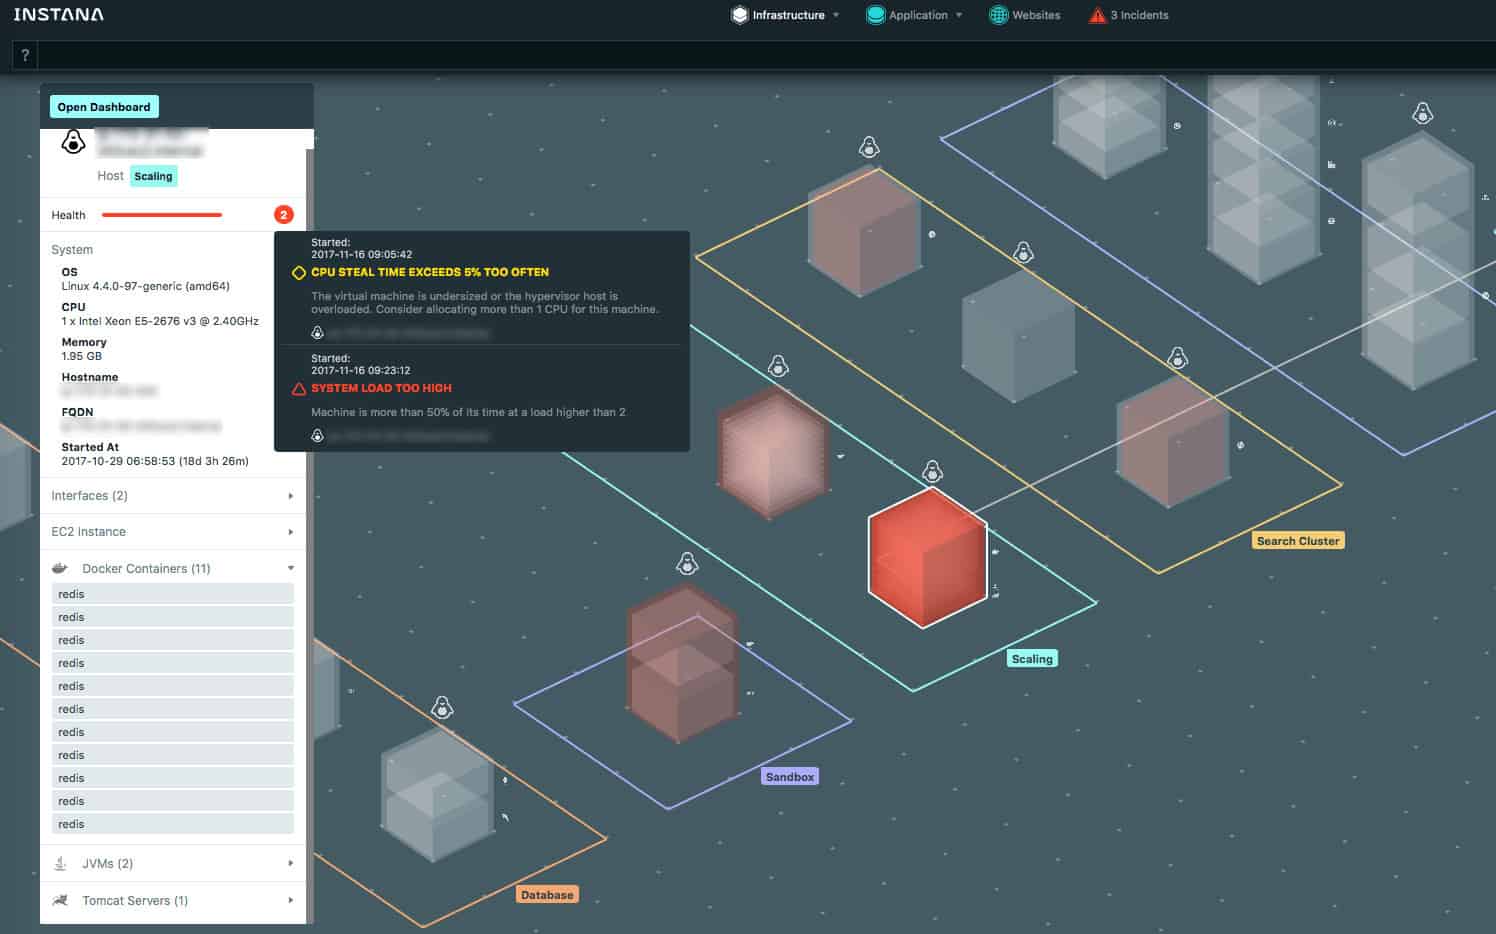
Instana is an application performance monitoring tool with a range of support for Cassandra. Once Instana is deployed it will automatically detect Cassandra. The autodiscovery features help you to get set up quickly without having to manage lots of manual configurations. Visibility-wise, the software shows right down to node-level metrics like Requests, Client Read/Write Latencies and Pending Requests. There is also cluster-level metrics which show you keyspace details, replication factors, and disk sizes.
You can also monitor the health of Cassandra via the Dynamic Graph. The Dynamic Graph displays infrastructure events alongside a timeline so you can see how performance is changing over time. Having this information in front of you gives you a clear perspective of the performance trends impacting the service.
There are two versions of Instana available to purchase: Infrastructure Monitoring and Application Performance Management. Infrastructure Monitoring costs $11 (£8) per host per month with unlimited users and over 100 sensors. The Application Performance Management package costs $75 (£60) per host, per month and includes infrastructure monitoring, end-user monitoring, and analytics. You can download the free trial.
What Tool Should I Use to Monitor Apache Cassandra?
If you’re currently using Apache Cassandra to manage your databases then a monitoring solution is essential. A good infrastructure monitoring tool will help to make sure that your database performs. Tools like SolarWinds Server & Application Monitor, Datadog, and ManageEngine Applications Manager are well known for providing deep visibility into the physical and virtual infrastructure.
In terms of configuration and depth, Dynatrace is one of the best on this list (particularly because of its ability to detect Cassandra automatically!). However, if you want more of the dashboard-based approach to monitoring, SolarWinds Server & Application Monitor and Datadog are the way to go.