To learn more about the DataStax open-source project, Metric Collector for Apache Cassandra and to try a demo, visit us on GitHub.
Apache Cassandra is a resilient system for users to build applications on, but many operators see Cassandra as a bit of a black box. It’s not that Cassandra doesn’t have hundreds of metrics to consume, it does (over 300 metric series per table!). The fact is visualizing and getting a unified view of the cluster combined with OS-level metrics and application metrics is not an easy thing for Cassandra users to set up.
What is the Metrics Collector for Apache Cassandra?
To help solve this problem, DataStax released a new open source project called the Metric Collector for Apache Cassandra (MCAC for short). This project provides a drop-in solution to solve this monitoring gap for Apache Cassandra. Here’s how it works.
MCAC is built on the widely used collectd agent but with a novel twist. Collectd is a metric collection agent that is well adopted and integrates well with all kinds of external metrics systems like, prometheus, graphite, stackdriver, and others. While collectd can scrape JMX metrics out of the box, JMX scraping can be quite slow and works best with only a subset of metrics. Not to mention many people don’t want to maintain and configure the metric agent on every node.
We use MCAC to power the health tab in Astra and is bundled with our Kubernetes operator for Apache Cassandra.
Why MCAC is different
To solve this problem MCAC comes as a single bundle with our java agent and a linux portable collectd build all in one. Just add the agent to the cassandra-env.sh, it brings up collectd and ships every metric in Cassandra to collectd via a unix-socket. It works on all Apache Cassandra versions from 2.2 -> 4.0.
By shipping the metrics this way efficiently it is able to export hundreds of thousands of series per node with little/no impact on C* performance.
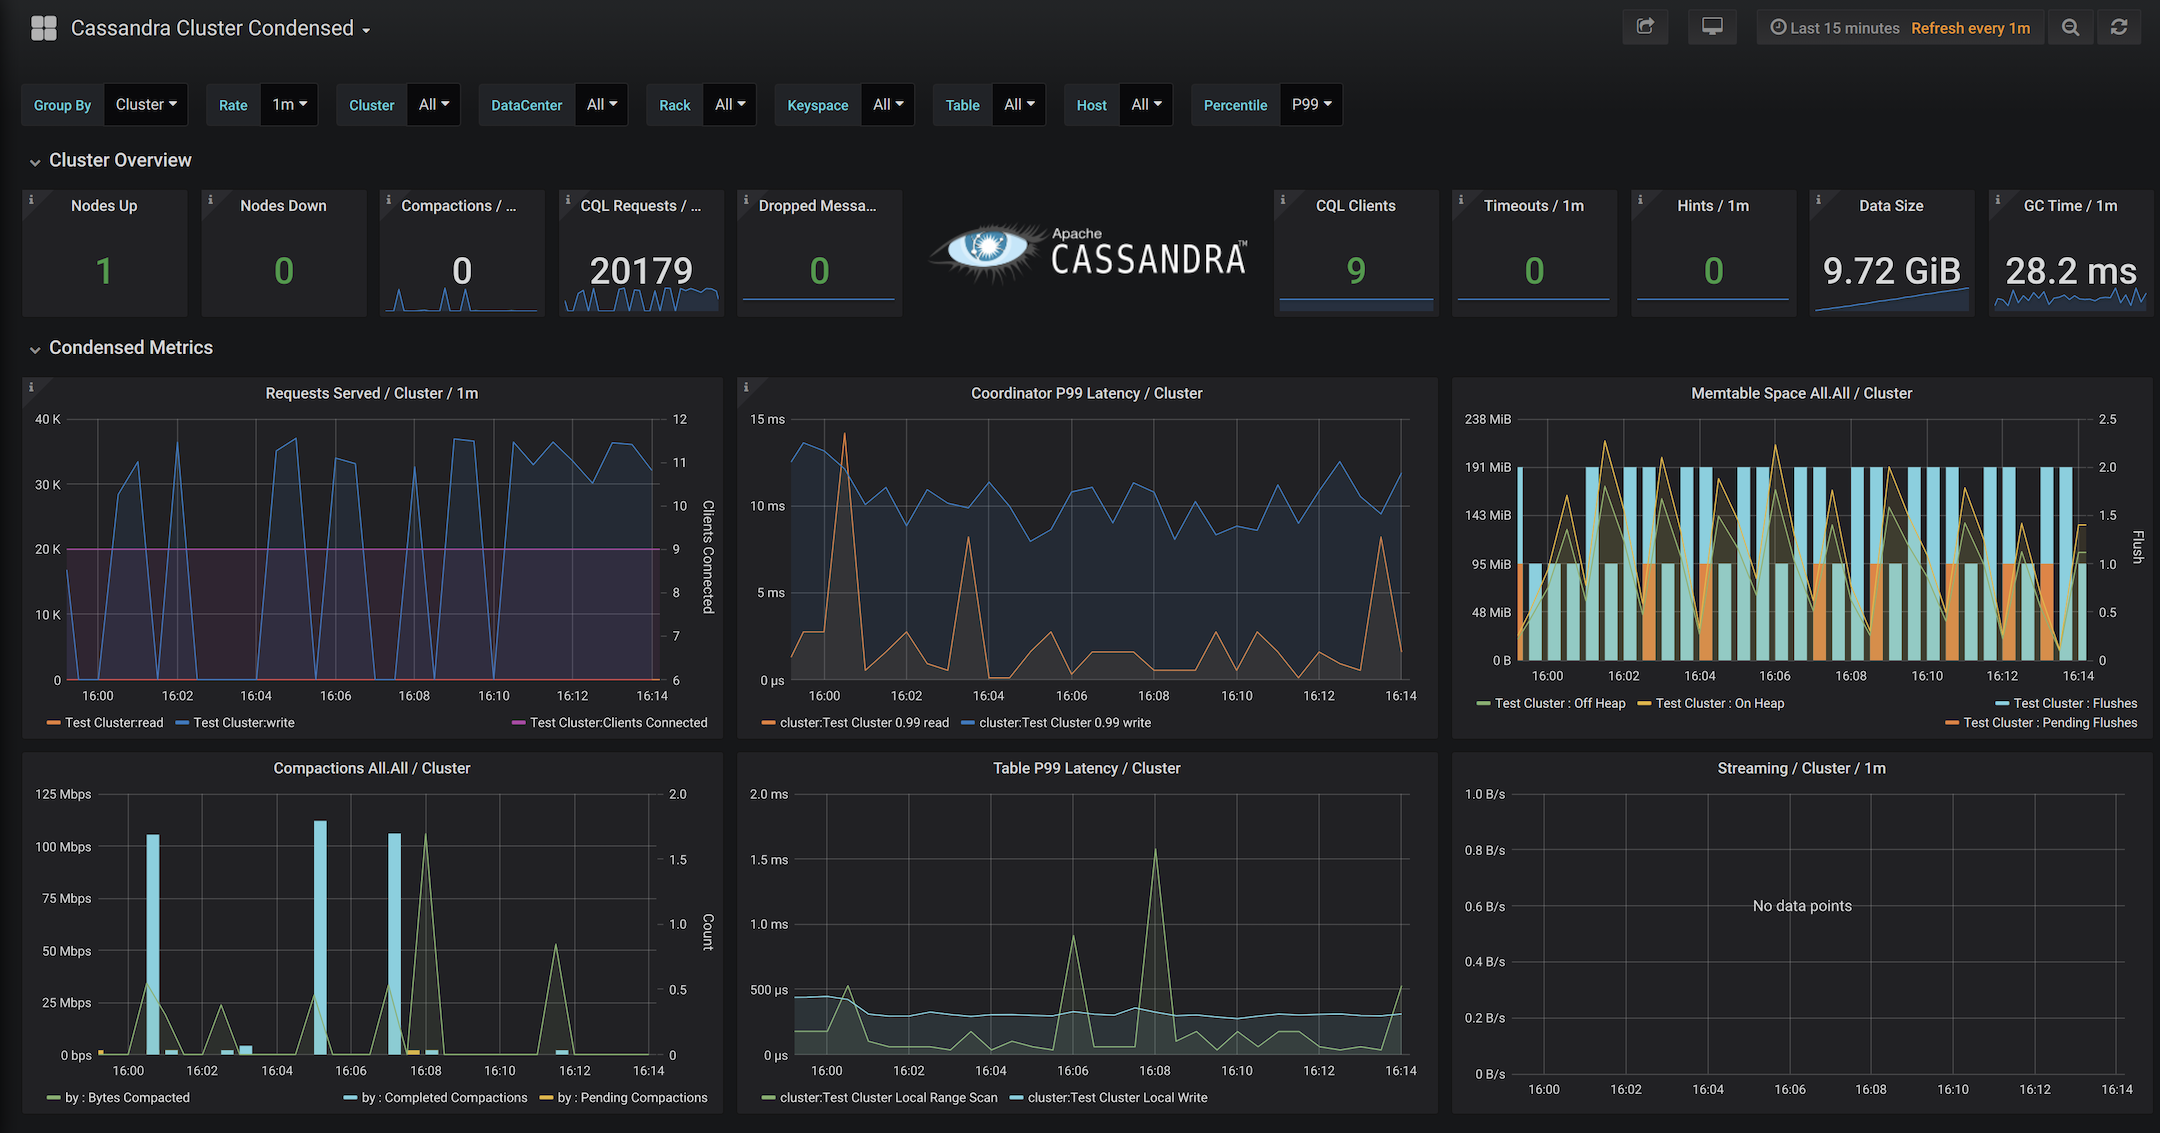
Not only does it send the metrics, but it is specially designed to work well with prometheus out of the box, like histograms are tailored for aggregation by prometheus and labels are automatically converted on ingest. This means you can slice and dice metrics across DCs, racks, down to even tables.
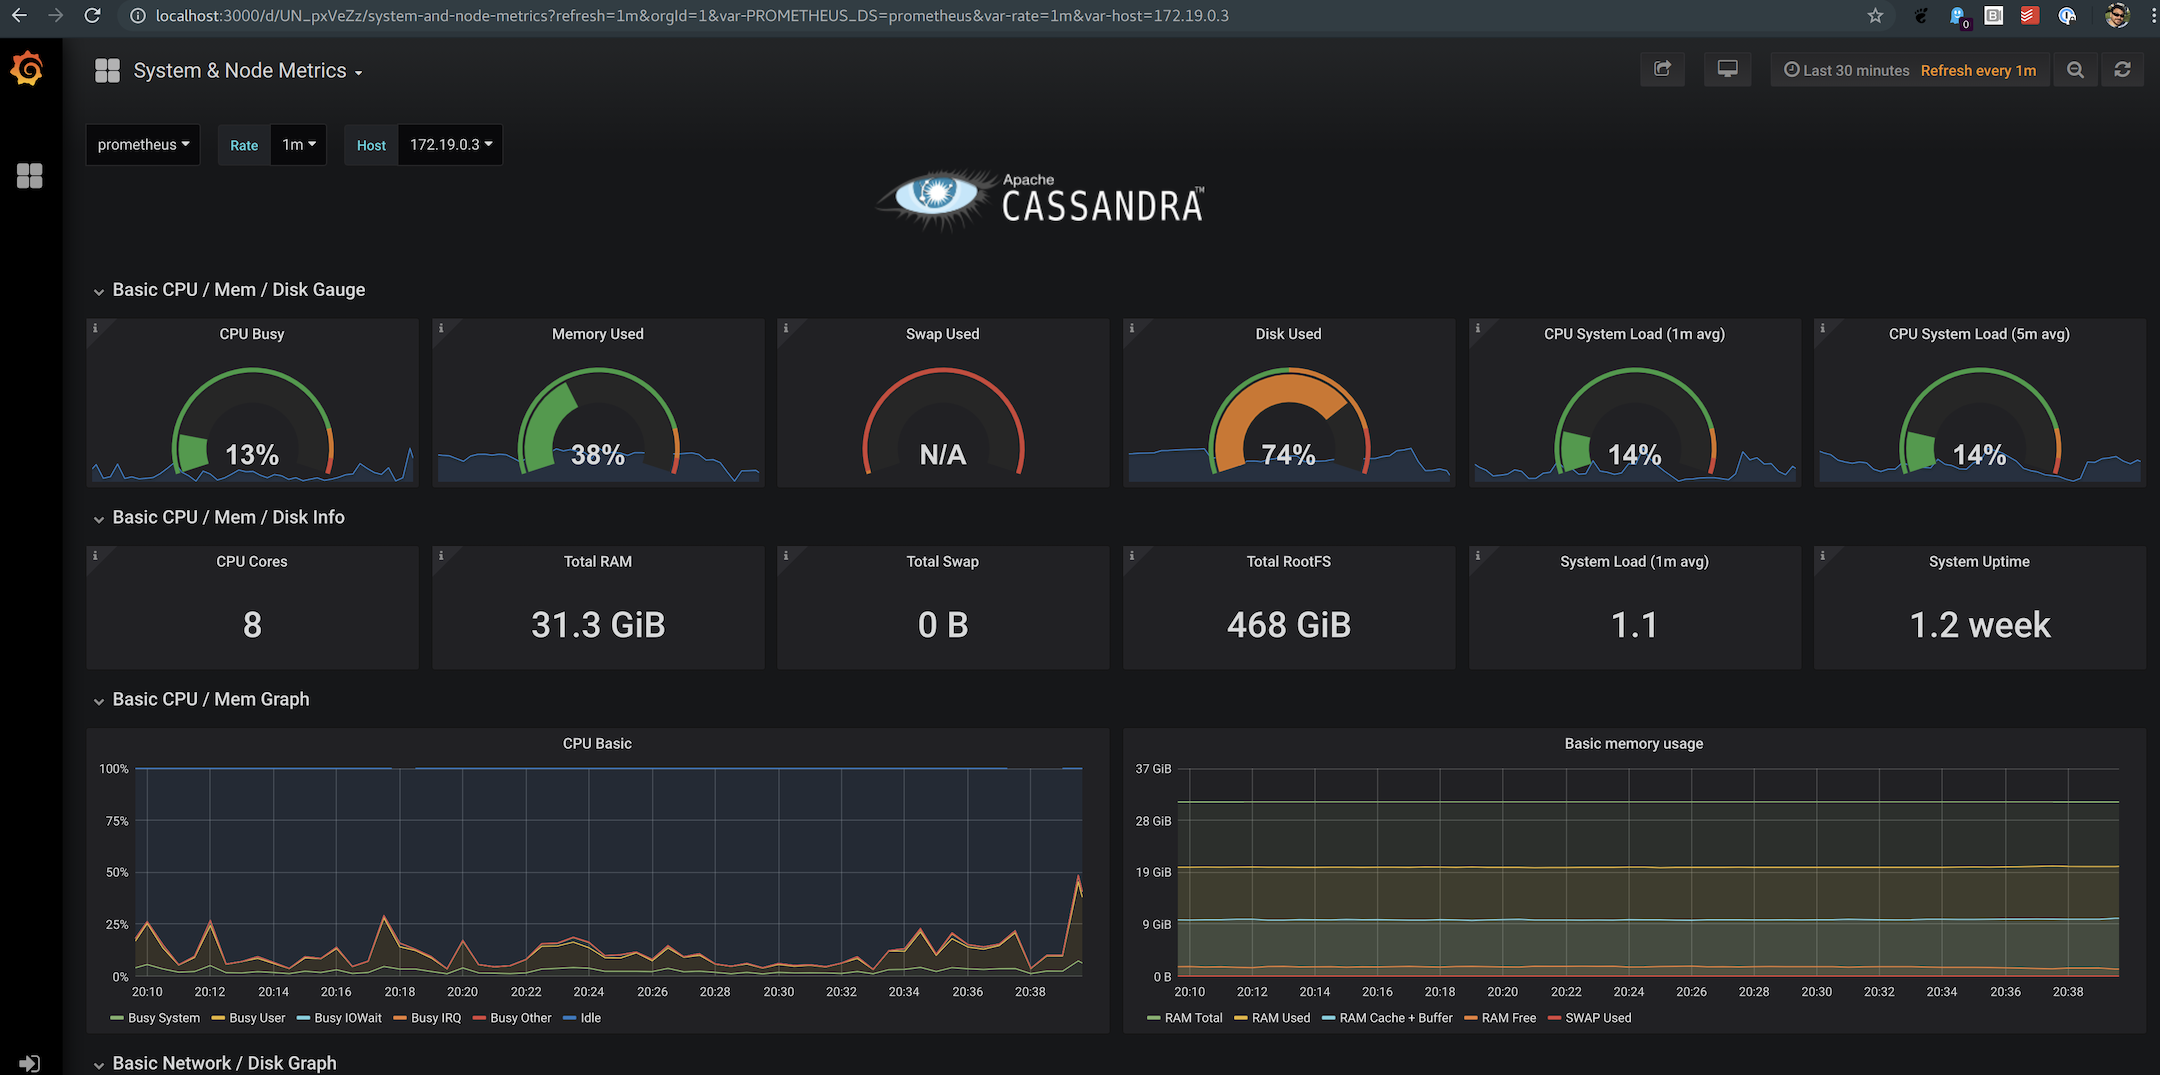
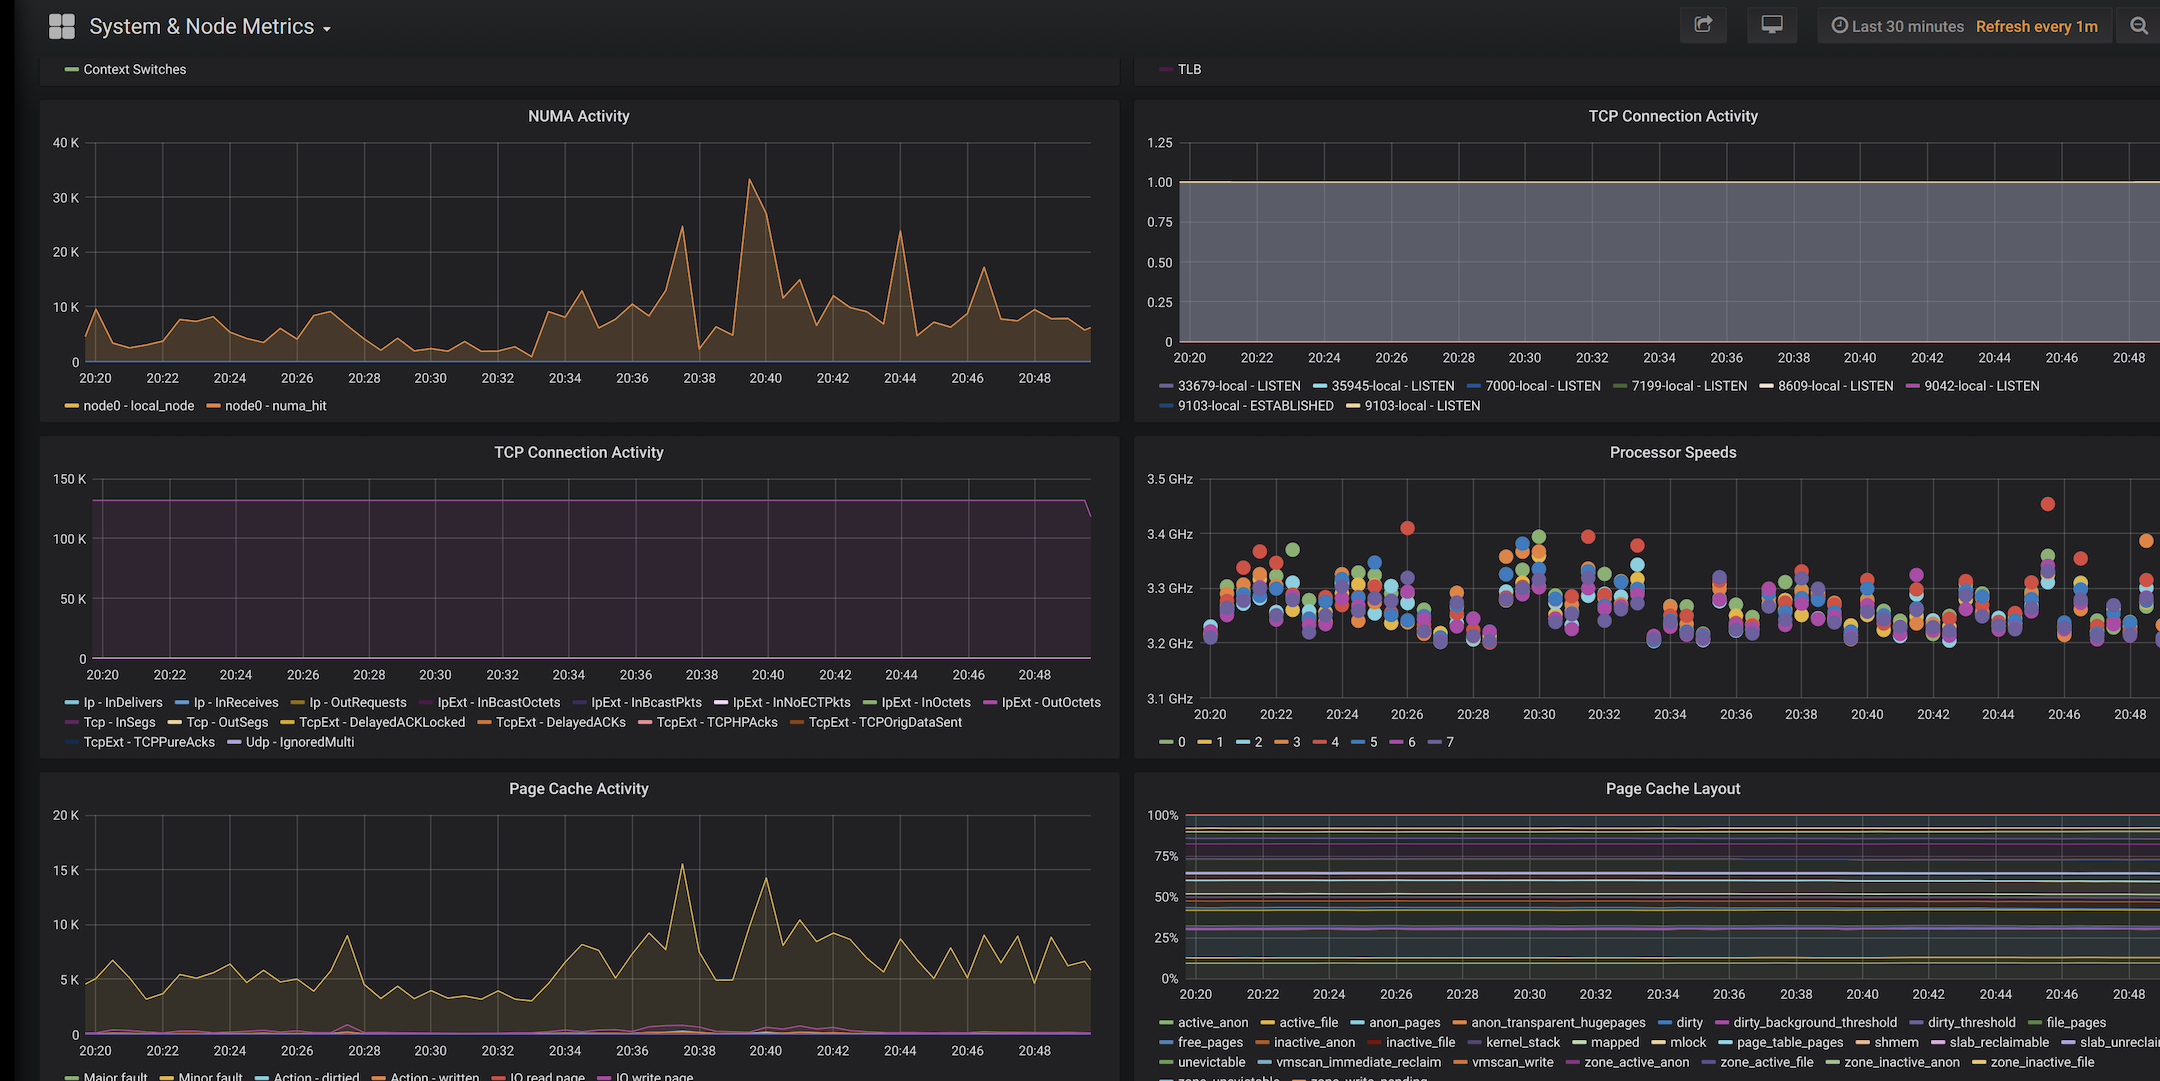
The Cassandra metrics are one aspect of the equation but with collectd we can also gather and expose all the OS level metrics, like context switches and disk/network performance.
MCAC also creates a historical log on the nodes of metric and non-metric diagnostic events related to activity on the node. Non-metric events include details on Flushes, Compactions, Exceptions, GC, etc. This DataLog can be used to help analyze performance or other impacting issue on the cluster. If you need help our SRE team is available to help you diagnose problems with this log https://www.datastax.com/keepcalm and if you have any questions we're here to help at https://community.datastax.com/.
Finally, what good are all these metrics without a way to visualize them! To tie it all together, MCAC comes with pre-built grafana dashboards which give operators the best Cassandra monitoring solution out there. These dashboards will change over time to focus on specific aspects of the system to make it easier to drill into the cluster.