Illustration Image

Cassandra.Link

The best knowledge base on Apache Cassandra®

Helping platform leaders, architects, engineers, and operators build scalable real time data platforms.

4/29/2021

Reading time:6 min

[PromCon Recap] Two Households, Both Alike in Dignity: Cortex and Thanos

by John Doe

This blog post is a writeup of the presentation Bartek Plotka and I gave at PromCon 2019.Cortex is a horizontally scalable, clustered Prometheus implementation aimed at giving users a global view of all their Prometheus metrics in one place, and providing long term storage for those metrics. Thanos is newer project aimed at solving the same challenges. In this blog post, we compare these two projects and see how it is possible to have two completely different approaches to the same problems.[embedded content]The Cortex Project was started in 2016 by Julius Volz and me, and joined the CNCF sandbox in 2018. Thanos was started in 2017 by Fabian Reinartz and Bartłomiej Płotka, and joined the CNCF sandbox in 2019. Both are written in Go, hosted on Github, and re-use large swathes of Prometheus codebase. Both projects aim to solve the same problems: a global view of all your metrics, highly available monitoring with gaps, and long term storage.1. Global View: Queries over Data from Multiple Prometheus ServersPrometheus is a pull-based monitoring system; as such, Prometheus servers need to be colocated with the jobs and infrastructure they are monitoring. This works extremely well when your application is deployed in one region; when you start deploying in multiple regions, you need Prometheus servers in each region. And when you want to run queries that cover data in both regions, you can’t. This is the first problem that Cortex and Thanos set out to solve.Thanos reuses your existing Prometheus servers in your existing clusters. A new stateless service, the Thanos Querier, “fans out” queries to these existing Prometheus servers. The existing Prometheus servers need an added sidecar (the Thanos Sidecar) deployed alongside them in order to handle these queries. In Cortex, requests flow in the opposite direction – your existing Prometheus servers push data to a central, scalable Cortex cluster using Prometheus’ built-in remote-write capability. The central Cortex cluster stores all the data and handles queries “locally.” This presents us with our first tradeoff: query performance and availability. With Thanos, chunk data must be pulled back from the “edge” locations to a central location where your Thanos queriers are running. If there is an interruption in this wide-area network, your query performance and availability will suffer. In the worst case, the latest 2 hours of data may not be available for querying. As Cortex relies on a push-based model for centrally aggregating the data, when an edge location becomes unavailable, all data up to that point is still available centrally. On the other hand, with Cortex you need to manage a separate Cortex cluster and storage on top of your Prometheus deployment – Thanos leverages your existing deployment.2. HA Prometheus: No Gaps in the GraphsPrometheus runs as a single process on a single computer; if that computer fails, the operating system needs updating, or Prometheus needs restarting, you end up with gaps in your graphs. To work around this, the best practice is to deploy a pair of Prometheus servers in each region; if one fails, the idea is the other one continues to scrape your jobs and store metrics. But this doesn’t solve the gaps problem – out of the box, Prometheus doesn’t provide a way to merge data from multiple replicas.However, Thanos does! The Thanos querier will read from both replicas and combine the metrics into a single, no-gaps-included result. As the two replicas may naturally be slightly out-of-sync, Thanos uses a heuristic to determine which results to show to avoid gaps. Cortex takes a different approach. As each replica is pushing samples to the central Cortex cluster, Cortex deduplicates the streams and only stores a single copy. Cortex relies on tracking the last push from each replica and using a simple timeout to “elect” the other replica as the master. Both systems result in a very similar experience: gapless graphs in Grafana.3. Long Term Storage: Store Data for Long-Term AnalysisPrometheus is designed to run with as few dependencies as possible; it uses the local network to gather metrics and stores data on the local disk. Even through the storage format is capable of almost indefinite retention, truly durable long-term storage needs to consider disk failure, replication, and recovery.Thanos offloads Prometheus TSDB blocks to object stores; 7 different object stores are supported. Two-hour-long blocks are built locally and then uploaded to the object store by the Thanos sidecar. A separate microservice – the Thanos Store Gateway – is used to handle queries against the blocks in object storage. Responsibility for the durability of the blocks is offloaded to the object store – a wise choice, as replication and repair is difficult to get right. Cortex takes a similar approach, offloading the responsibility for durability and replication to managed services. The key differences are that Cortex stores individual Prometheus chunks in an object store and a custom index in a NoSQL store – recall that a TSDB block is a collection of chunks from multiple time series with an included index. At Grafana Labs, we store both the index and the chunks in a Google Bigtable cluster, although both Cassandra and AWS DynamoDB are supported. When comparing these approaches it boils down to two things: cost and performance. Both systems use managed services, and both systems can be run with a single dependency. Managed NOSQL stores (such as Google Bigtable or AWS DynamoDB) tend to cost more per GB stored than object stores (such as Google Cloud Storage or AWS S3), although they tend to cost less per IOP. This does tend to lead to a higher TCO for a Cortex-style system than a Thanos-style system. On the other hand, using a NOSQL store for the index in Cortex gives it an edge when it comes to query performance and scalability. Future CollaborationAs the Cortex and Thanos projects both aim to solve the same problems, both make heavy use of the existing Prometheus codebase, and two of the maintainers both live in London, we have been collaborating more and more over the past year.The first example of this collaboration is that we have made the Cortex query frontend, a caching and parallelization service that accelerates PromQL queries, work for Thanos. You can read more about it in our previous blog post, How to Get Blazin’ Fast PromQL. We are really excited to be able to bring these optimizations to a wider audience and welcome contributions to improve Thanos support.The second example of collaboration is making it possible for Cortex to use Thanos’ blocks-in-object-storage approach, reusing the existing Thanos code to achieve this. My thanks go out to Thor at DigitalOcean for putting in the legwork to make this happen. While it’s not quite ready for production usage yet, we’re really excited about the TCO improvements this will bring to Cortex, and are hoping to work closely with the Thanos team to improve scalability and performance.I’m always amazed at how two different groups of engineers can come up with completely different (and hopefully equally valid) solutions to the same problems. At Grafana Labs, we use Cortex to power Grafana Cloud’s Prometheus service, and have recently starting using Thanos internally to monitor it. I’m excited to see what the future holds for Cortex and Thanos!

Illustration Image

This blog post is a writeup of the presentation Bartek Plotka and I gave at PromCon 2019.

Cortex is a horizontally scalable, clustered Prometheus implementation aimed at giving users a global view of all their Prometheus metrics in one place, and providing long term storage for those metrics. Thanos is newer project aimed at solving the same challenges. In this blog post, we compare these two projects and see how it is possible to have two completely different approaches to the same problems.

The Cortex Project was started in 2016 by Julius Volz and me, and joined the CNCF sandbox in 2018. Thanos was started in 2017 by Fabian Reinartz and Bartłomiej Płotka, and joined the CNCF sandbox in 2019. Both are written in Go, hosted on Github, and re-use large swathes of Prometheus codebase. Both projects aim to solve the same problems: a global view of all your metrics, highly available monitoring with gaps, and long term storage.

1. Global View: Queries over Data from Multiple Prometheus Servers

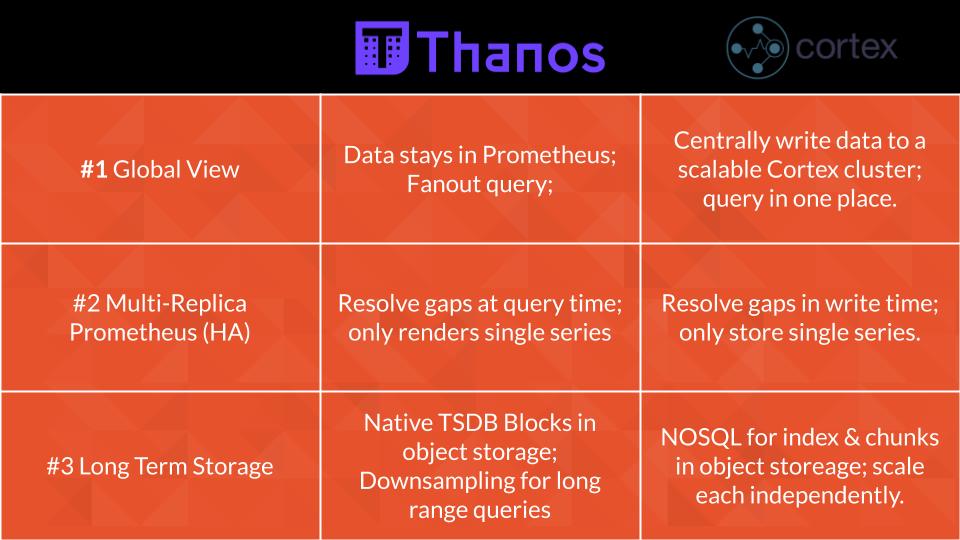
Prometheus is a pull-based monitoring system; as such, Prometheus servers need to be colocated with the jobs and infrastructure they are monitoring. This works extremely well when your application is deployed in one region; when you start deploying in multiple regions, you need Prometheus servers in each region. And when you want to run queries that cover data in both regions, you can’t. This is the first problem that Cortex and Thanos set out to solve.

Thanos reuses your existing Prometheus servers in your existing clusters. A new stateless service, the Thanos Querier, “fans out” queries to these existing Prometheus servers. The existing Prometheus servers need an added sidecar (the Thanos Sidecar) deployed alongside them in order to handle these queries.
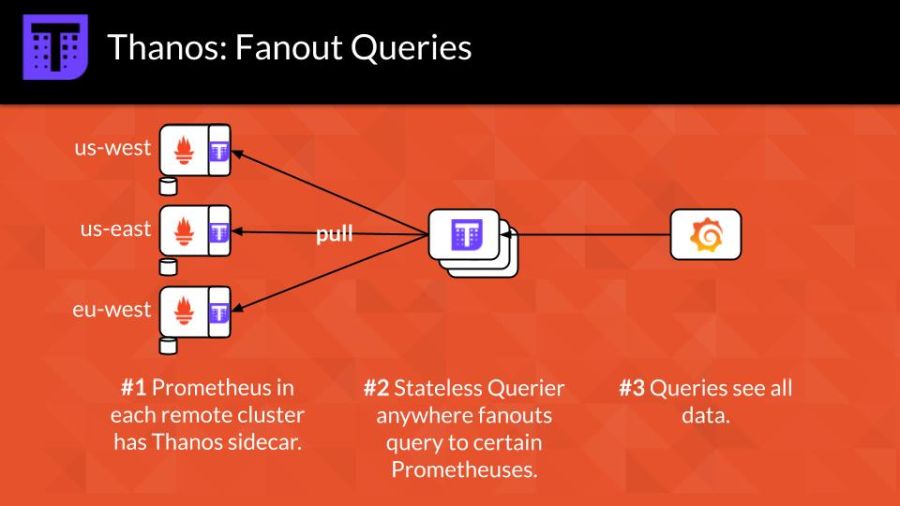
Thanos: Fanout Queries

In Cortex, requests flow in the opposite direction – your existing Prometheus servers push data to a central, scalable Cortex cluster using Prometheus’ built-in remote-write capability. The central Cortex cluster stores all the data and handles queries “locally.”
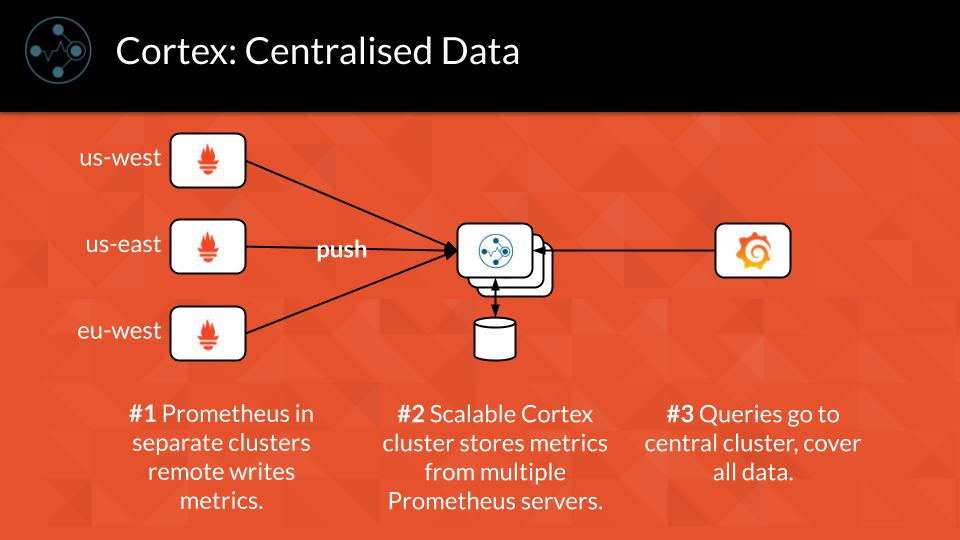
Cortex: Centralized Data

This presents us with our first tradeoff: query performance and availability. With Thanos, chunk data must be pulled back from the “edge” locations to a central location where your Thanos queriers are running. If there is an interruption in this wide-area network, your query performance and availability will suffer. In the worst case, the latest 2 hours of data may not be available for querying. As Cortex relies on a push-based model for centrally aggregating the data, when an edge location becomes unavailable, all data up to that point is still available centrally. On the other hand, with Cortex you need to manage a separate Cortex cluster and storage on top of your Prometheus deployment – Thanos leverages your existing deployment.

2. HA Prometheus: No Gaps in the Graphs

Prometheus runs as a single process on a single computer; if that computer fails, the operating system needs updating, or Prometheus needs restarting, you end up with gaps in your graphs. To work around this, the best practice is to deploy a pair of Prometheus servers in each region; if one fails, the idea is the other one continues to scrape your jobs and store metrics. But this doesn’t solve the gaps problem – out of the box, Prometheus doesn’t provide a way to merge data from multiple replicas.

However, Thanos does! The Thanos querier will read from both replicas and combine the metrics into a single, no-gaps-included result. As the two replicas may naturally be slightly out-of-sync, Thanos uses a heuristic to determine which results to show to avoid gaps.
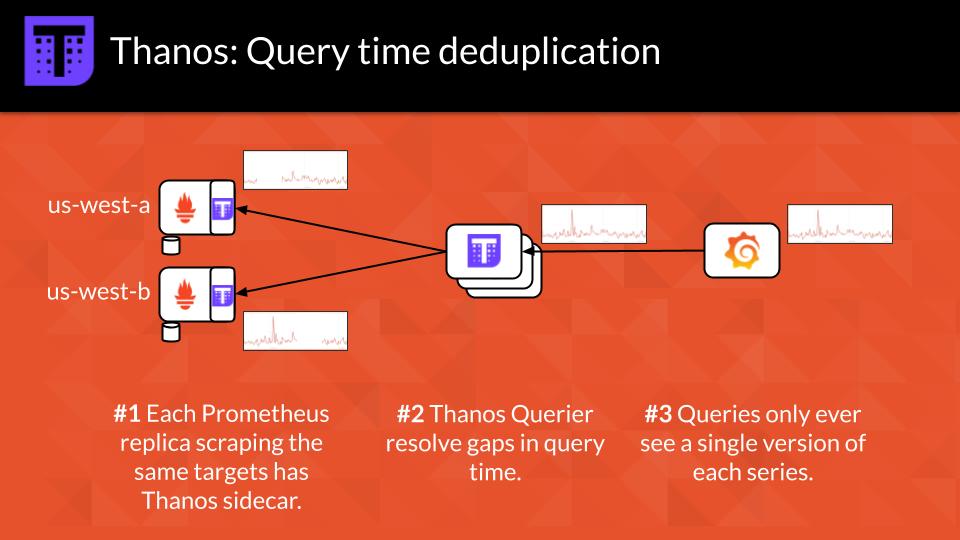
Thanos: Query Time Deduplication

Cortex takes a different approach. As each replica is pushing samples to the central Cortex cluster, Cortex deduplicates the streams and only stores a single copy. Cortex relies on tracking the last push from each replica and using a simple timeout to “elect” the other replica as the master.
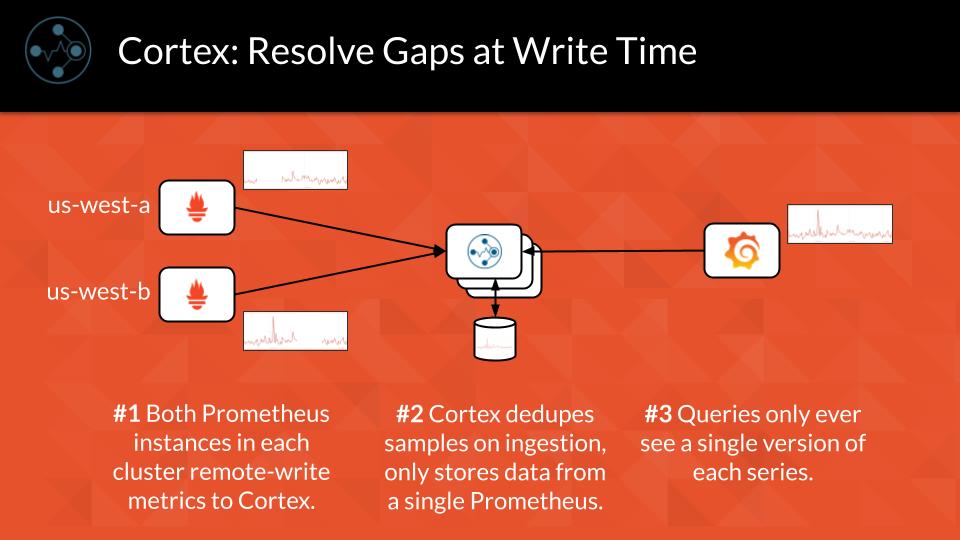
Cortex: Resolve Gaps at Write Time

Both systems result in a very similar experience: gapless graphs in Grafana.

3. Long Term Storage: Store Data for Long-Term Analysis

Prometheus is designed to run with as few dependencies as possible; it uses the local network to gather metrics and stores data on the local disk. Even through the storage format is capable of almost indefinite retention, truly durable long-term storage needs to consider disk failure, replication, and recovery.

Thanos offloads Prometheus TSDB blocks to object stores; 7 different object stores are supported. Two-hour-long blocks are built locally and then uploaded to the object store by the Thanos sidecar. A separate microservice – the Thanos Store Gateway – is used to handle queries against the blocks in object storage. Responsibility for the durability of the blocks is offloaded to the object store – a wise choice, as replication and repair is difficult to get right.
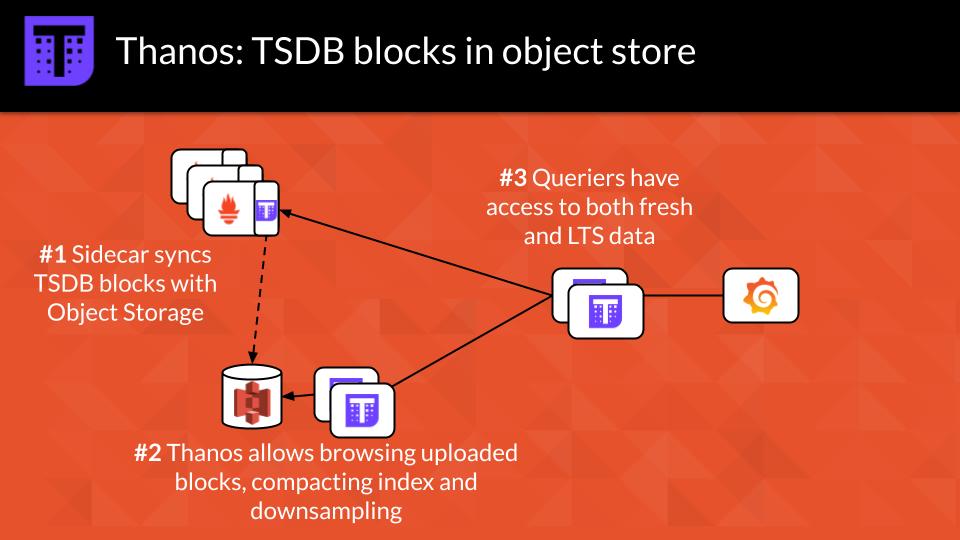
Thanos: TSDB Blocks in Object Store

Cortex takes a similar approach, offloading the responsibility for durability and replication to managed services. The key differences are that Cortex stores individual Prometheus chunks in an object store and a custom index in a NoSQL store – recall that a TSDB block is a collection of chunks from multiple time series with an included index. At Grafana Labs, we store both the index and the chunks in a Google Bigtable cluster, although both Cassandra and AWS DynamoDB are supported.
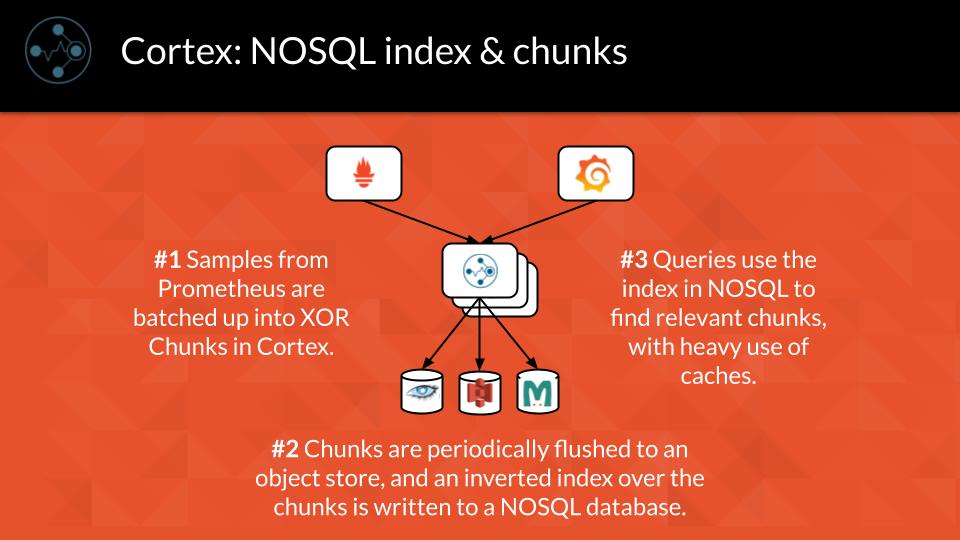
Cortex: NoSQL Index & Chunks

When comparing these approaches it boils down to two things: cost and performance. Both systems use managed services, and both systems can be run with a single dependency. Managed NOSQL stores (such as Google Bigtable or AWS DynamoDB) tend to cost more per GB stored than object stores (such as Google Cloud Storage or AWS S3), although they tend to cost less per IOP. This does tend to lead to a higher TCO for a Cortex-style system than a Thanos-style system. On the other hand, using a NOSQL store for the index in Cortex gives it an edge when it comes to query performance and scalability.
Thanos vs. Cortex

Future Collaboration

As the Cortex and Thanos projects both aim to solve the same problems, both make heavy use of the existing Prometheus codebase, and two of the maintainers both live in London, we have been collaborating more and more over the past year.

The first example of this collaboration is that we have made the Cortex query frontend, a caching and parallelization service that accelerates PromQL queries, work for Thanos. You can read more about it in our previous blog post, How to Get Blazin’ Fast PromQL. We are really excited to be able to bring these optimizations to a wider audience and welcome contributions to improve Thanos support.

The second example of collaboration is making it possible for Cortex to use Thanos’ blocks-in-object-storage approach, reusing the existing Thanos code to achieve this. My thanks go out to Thor at DigitalOcean for putting in the legwork to make this happen. While it’s not quite ready for production usage yet, we’re really excited about the TCO improvements this will bring to Cortex, and are hoping to work closely with the Thanos team to improve scalability and performance.

I’m always amazed at how two different groups of engineers can come up with completely different (and hopefully equally valid) solutions to the same problems. At Grafana Labs, we use Cortex to power Grafana Cloud’s Prometheus service, and have recently starting using Thanos internally to monitor it. I’m excited to see what the future holds for Cortex and Thanos!
Related Articles

migration
cassandra
kubernetes

How to Migrate Your Cassandra Database to Kubernetes with Zero Downtime

DataStax

11/15/2023

cassandra
kubernetes

Checkout Planet Cassandra

Claim Your Free Planet Cassandra Contributor T-shirt!

Make your contribution and score a FREE Planet Cassandra Contributor T-Shirt! 
We value our incredible Cassandra community, and we want to express our gratitude by sending an exclusive Planet Cassandra Contributor T-Shirt you can wear with pride.

Join Our Newsletter!

Sign up below to receive email updates and see what's going on with our company

Explore Related Topics

AllKafkaSparkScyllaSStableKubernetesApiGithubGraphQl

Explore Further

cortex