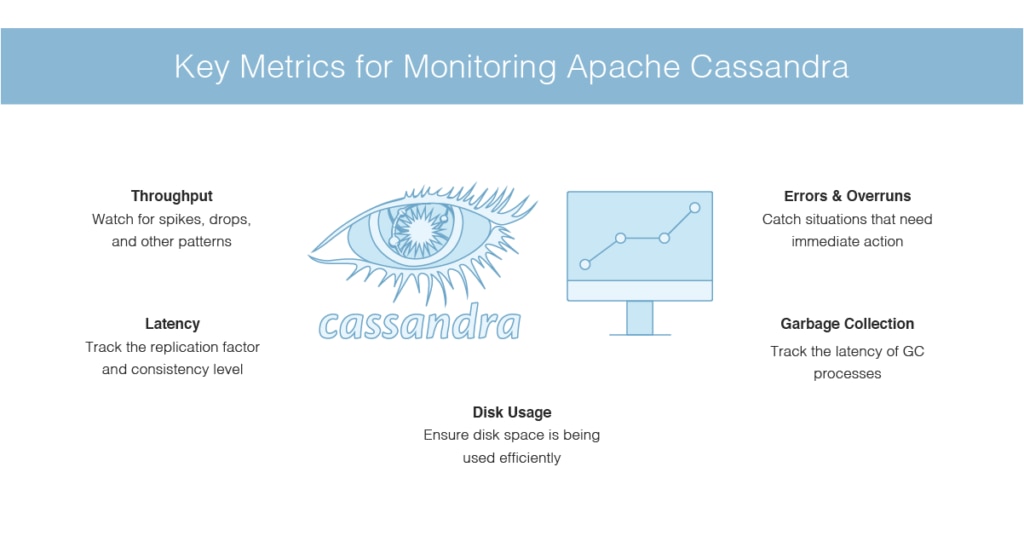
NoSQL databases like Apache Cassandra and MongoDB are designed to support massive data processing and storage. Cassandra database systems are highly scalable and fault-tolerant. Hence, Cassandra clusters with a multitude of nodes can greatly increase the complexity of your data infrastructure. Understanding the performance of your Cassandra clusters is critical for diagnosing issues and planning capacity.
Applications Manager, one of the best Cassandra monitoring tools in the industry enables comprehensive Apache Cassandra performance monitoring and administration of all nodes in a cluster from a centralized console. You can collect statistical data from all JVMs in a cluster and key performance metrics like memory utilization statistics, task statistics of thread pools, storage statistics, CPU usage, operation performance, latency, and pending tasks.
Cluster Management
You can continuously monitor Cassandra database clusters with Applications Manager's dashboard detailing the health, availability, and performance status of all the monitored clusters. Monitoring Cassandra clusters helps retrieve details on live, leaving, moving, joining, and unreachable nodes and monitor the health of nodes within each cluster.

Monitor memory consumption
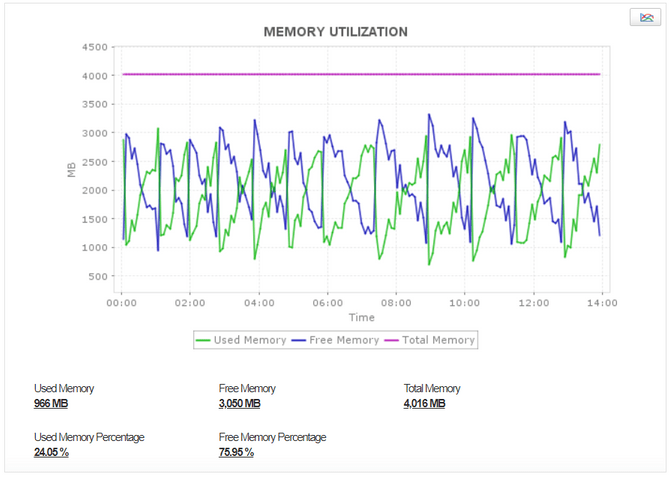
Cassandra databases consume a lot of memory and application performance issues may result if your RAM is not sufficient. Applications Manager closely monitors the memory consumption of your applications running on the Cassandra environment and displays the used, free, and total memory of the server in megabytes.
Get notified of high CPU usage in Cassandra cluster nodes
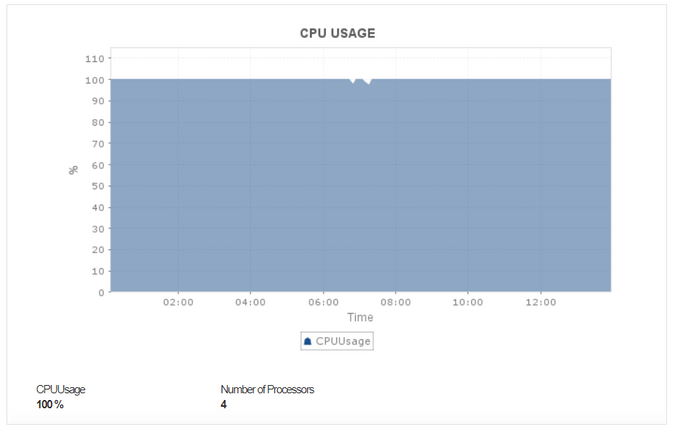
Like with any other database system, Cassandra's performance depends on the underlying systems on which it runs. Applications Manager's Cassandra cluster monitoring capabilities include tracking operating system metrics on your Cassandra nodes like the number of processors, exceptions, CPU utilization, and time trends. This can help you identify and troubleshoot hardware-related performance problems.
Storage Statistics
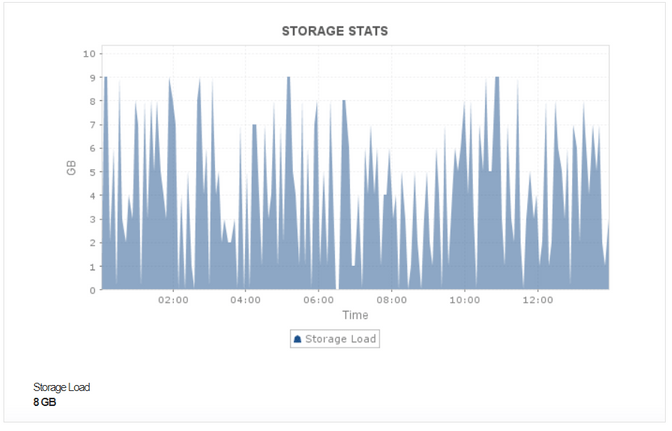
If you have significant amounts of data, monitoring and predicting disk space usage is no simple task. Disk space usage can vary fairly over time within a Cassandra environment. Applications Manager's Cassandra monitor tracks disk utilization and storage statistics over defined time periods to help identify and remedy performance issues.
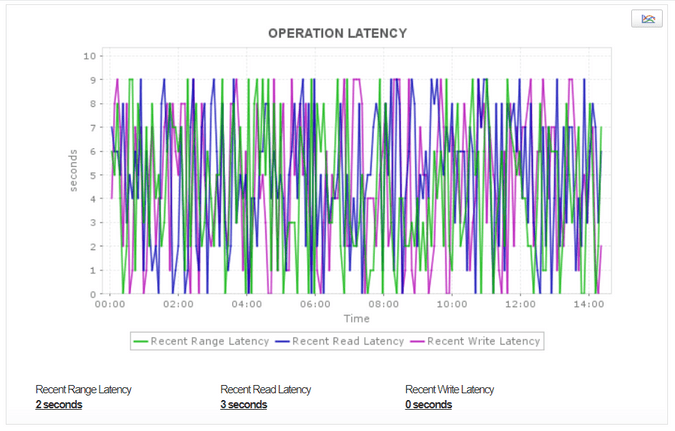
Operations Stats
Track operations stats and latency (averages and totals) of range, read, and write operations per second at the server level. The recent read latency and write latency counters are important for ensuring that operations are functioning consistently. Applications Manager also tracks the number of completed compactions since the last start of a Cassandra instance, pending, and other compaction tasks waiting in the queue to be executed.
Thread Pool Statistics
Monitor the behavior of thread pools and task statistics. Applications Manager monitors distinct Cassandra thread pools and provide statistics on the number of tasks that are active, pending, completed and blocked. Monitoring trends on these pools for increases in the pending tasks column can help you plan add additional capacity.

Keep an eye on dropped messages
With Applications Manager's Cassandramonitor, you can deal with overload scenarios in your Cassandra environment by keeping a lookout for dropped messages. You can receive a log summary of dropped messages along with the message type. You can establish thresholds and configure alarms to notify you of dropped messages.

Keyspace Details
Applications Manager's Cassandra DB Monitoring solution can help you get an overview of latency and memory table details for each Keyspace. It can track various parameters such as Read Latency, Write Latency, Memory table columns, heap size, switch count, and live data size. It can also track general Keyspace details such as Live disk space used, Bloom Filter Disk Space Used(KB), and Index Summary OFF heap Memory Used(KB). These details help admins in optimizing performance by tending to keyspaces with latency. It can also help in identifying about-to-overflow memory tables preventing a potential outage.
Furthermore, Applications Manager's Apache Cassandra database monitoring tool also gives information about the database (cache, compaction manager, dynamic endpoint snitch, storage proxy, etc.), internal details (Anti entropy stage, Gossip stage, cache clean up executor, etc.) , Request (mutation stage, read repair stage, read stage details, etc.), dropped messages, and CQL (Cassandra Query Language) statement details to name a few.
Applications Manager can help you monitor Cassandra performance and instantly alert you if your Cassandra node is under performing and help you find the root cause of performance bottlenecks. You can also use Applications Manager to monitor the application servers, servers - physical or virtual, and traditional databases that are normally used along with NoSQL databases in the real world.Applications Manager can also monitor the application servers, servers - physical or virtual and traditional databases that are normally used along with NoSQL databases in the real world.


