Databases are foundational to the operations of many modern businesses and organizations. They store information in tables, which authorized applications can then access, retrieve, or edit, depending on what information is needed and for what purpose. In practice, databases allow customers to see product details when shopping online and allow health care providers to keep private patient information secure until medical professionals need access. As more information is added to databases, the time it takes to search for and retrieve data can increase drastically, which is why having an efficient database management system is crucial.
Apache Cassandra is an open-source database system adopted by many companies, including large corporations like Comcast, Instagram, and Netflix. Cassandra is the database solution of choice for these companies for a few reasons.
Cassandra uses a distributed, decentralized model to prevent database operations from being disrupted by single (or even several) points of failure. It’s well known for being highly fault-tolerant, and automatically replicates data across multiple nodes. It also scales linearly—doubling the size of a Cassandra cluster, for instance, will double your throughput without creating network bottlenecks. On top of all this, Cassandra works exceptionally well at processing writes at volume.
While Cassandra offers several baked-in features, it still needs to be properly monitored to ensure it’s functioning optimally. Several key Cassandra monitoring metrics need to be tracked to properly optimize database health and performance, a task potentially difficult—if not impossible—to do manually. This is why companies choose an Apache Cassandra monitoring tool to get the job done.
In this guide, I’ll walk you through how to monitor Cassandra. I’ll also provide an overview of SolarWinds Server & Application Monitor, my choice when it comes to Cassandra monitoring tools.
- How to Monitor Cassandra Performance
- Throughput
- Latency
- Disk Usage
- Garbage Collection
- Errors and Overruns
- My Choice for Cassandra Monitoring Tools
- Getting Started With Cassandra Performance Monitoring
How to Monitor Cassandra Performance
First and foremost, monitoring provides visibility. Visibility yields data, and data informs action. Database administrators can’t make informed decisions if they don’t have the data to inform them.
Monitoring Cassandra starts with collecting data from a set of performance metrics pertaining to the health of your data store. However, without a monitoring system to collect and synthesize this data, the performance metrics are just numbers. Cassandra monitoring tools will track the performance of hosts, processes, and even the metrics themselves to keep you in the know about the state of your database. Cassandra monitoring solutions not only aggregate the metrics data but often offer extremely useful features, such as data visualizations and alert systems designed to notify DBAs when metrics reach certain critical thresholds.
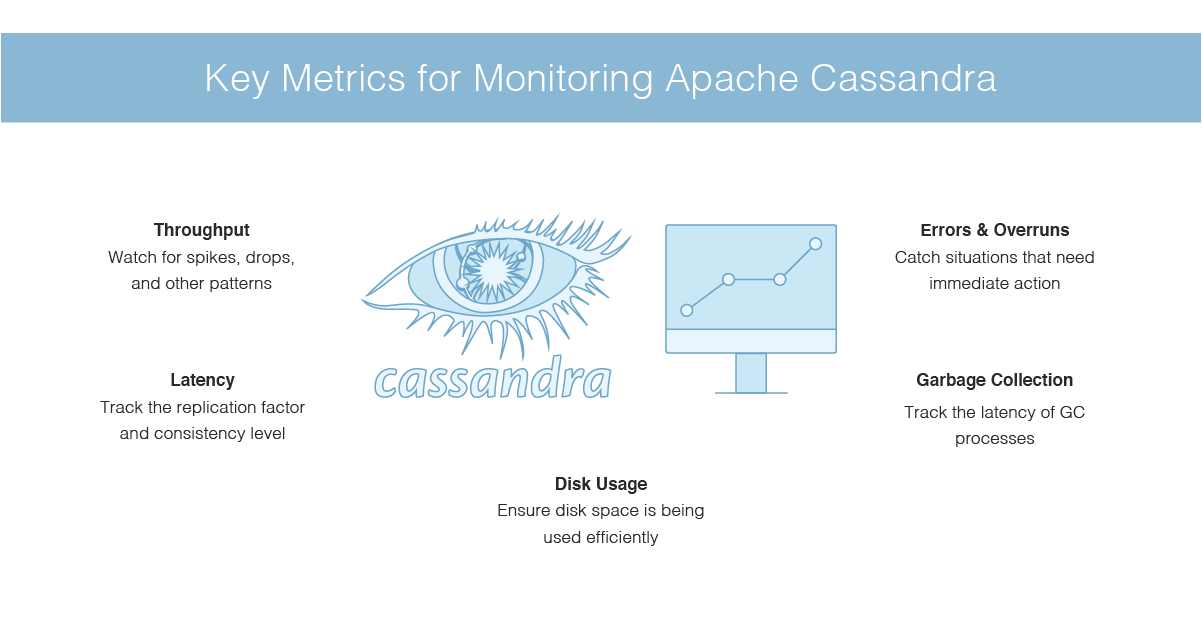
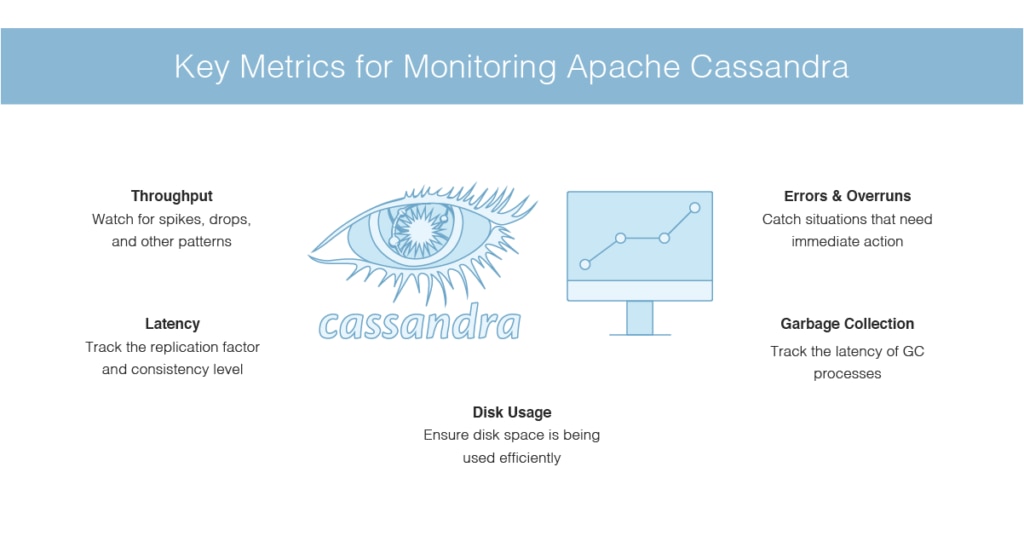
Monitoring the performance of Cassandra databases is key to identifying slowdowns or resource limitations before they affect your company’s overall operational performance. Some of the most important Cassandra monitoring metrics you should be tracking are throughput, latency, disk usage, garbage collection, and errors and overruns.
Read more about Apache Server Configuration: Apache Web Server Configuration Step by Step and Optimization Tips
Throughput
This is one of the more useful metrics to monitor. Tracking the read and write requests Cassandra receives will provide a bird’s-eye view of cluster performance and how clients are interacting with the database. Knowing how Cassandra is used should drive how you go about optimizing database performance. For example, knowing whether the database workload skews read- or write-heavy will likely affect your data compaction strategy.
Monitoring Cassandra’s throughput can provide visibility in near-real time, and also allows you to spot sustained spikes, unexpected drops, and other patterns potentially indicating problems within your system.
Latency
Latency is the amount of time required to fulfill a request. In addition to throughput, Cassandra monitoring tools should be tracking the read and write latencies. These can be signs of developing issues or changing usage patterns, which may require reoptimizing the database to increase performance.
There are a few factors possibly effecting latency, but it’s especially important to pay attention to the replication factor and consistency level, as these essentially control the number of independent operational steps required to complete individual requests.
Disk Usage
Cassandra monitoring extends to disk usage, giving DBAs visibility into how much space the database is using on each node of the cluster. This obviously helps prevent resource shortages, but it also helps ensure the available disk space is being used efficiently.
When Cassandra writes to a disk, it creates a file called an SSTable (short for Sorted String Table). SSTables are immutable files, so when data is updated, instead of overwriting the original, Cassandra creates a new, time-stamped SSTable. Cassandra periodically runs compaction processes, which consolidate the number of SSTables, eliminate outdated data, and free up disk space for use.
Garbage Collection
Cassandra is Java-based and therefore uses standard Java garbage collection processes to free up memory. This also means greater activity in a given cluster will result in the garbage collector running more frequently.
There are different garbage collection processes—such as ParNew and Concurrent Mark Sweep (CMS)—designed to free up memory from different generations of the heap, but the important thing to keep an eye on here is the latency of these processes. ParNew pauses all application threads when running, which can directly affect Cassandra’s performance metrics if there’s a sudden change in latency and increases in CMS latency can be a sign your system needs more memory.
Errors and Overruns
One function the best Cassandra monitoring tools provide is a customizable notification system keeping DBAs up to date on database performance. This is especially important in critical situations requiring immediate action, such as when a Cassandra cluster suddenly becomes unable to handle the incoming flow of queries and requests.
Tracking Cassandra’s error count is one way to stay on top of these sorts of critical issues. Errors can vary widely in terms of severity, which is why focusing on specific error types is also essential. Two worth monitoring are timeout and unavailable exceptions.
- Timeout exceptions are not fatal errors, but they can be signs of a network or disk space issue
- Unavailable exceptions, on the other hand, are more serious—and therefore more important to know about right away—as they’re often indicative of one or more downed nodes
My Choice for Cassandra Monitoring Tools
Cassandra monitoring solutions collect these metrics and many others and aggregate them, so DBAs have the information they need when they need it. My personal favorite tool for the job is Server & Application Monitor (SAM) for Apache Cassandra from SolarWinds.
SAM was designed for quick error detection and resolution, and it allows DBAs to zoom in on granular issues quickly—even from general network overviews—with a few clicks. It has one centralized dashboard, which is not only easy to use and intuitive to navigate, but also allows you to keep an eye on multiple metrics without any hassle.
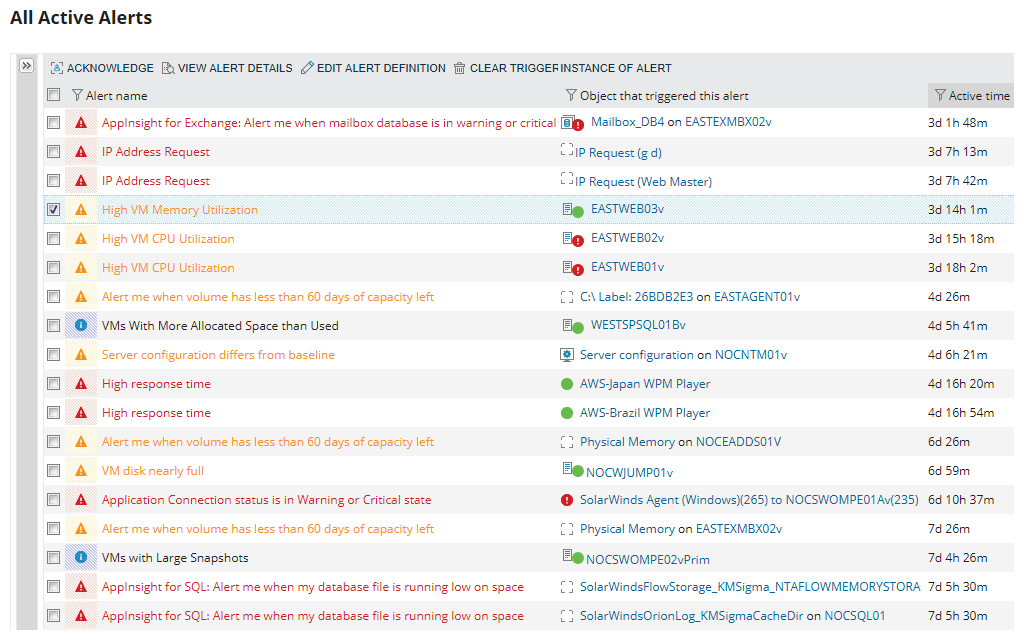
One of my favorite features of the software is its intelligent alerting system, which lets you customize when, how, and why you receive notifications. This keeps key players in the know without adding unnecessary notifications to anyone’s plate. The All Active Alerts page is useful, too—it displays a list of current alerts, along with information about how long each alert has been active.
Getting Started With Cassandra Performance Monitoring
Monitoring Apache Cassandra is vital to maintaining overall database health and performance. After reading this guide, you should have a handle on the key Cassandra monitoring metrics, and the benefits of implementing a monitoring tool. If you’re in need of a software solution for Cassandra monitoring, my vote is for SolarWinds SAM. Take advantage of the 30-day free trial, so you can test it out yourself.