In this topic, i will cover the basics of general Apache Cassandra performance tuning: when to do performance tuning, how to avoid and identify problems, and methodologies to improve.
When do you need to tune performance ?
optimizing:
when things work but could be better. we want to get better performance.
Troubleshooting:
fixing a problem that impact performance could actually be broken, could just be slow in clusters, something broken can manifest as slow performance.
What are some examples of performance related complaints an admin might receive regarding Cassandra ?
Performance-related complaints:
- it’s slow.
- certain queries are slow.
- program X that uses the cluster is slow.
- A node went down.
Latency, Throughput and the U.S.E Method:
Bad methodology
how not to approach performance-related problems?
In performance tuning, what are we trying to improve ?
latency – how long a cluster,node,server or I/O subsystem takes to respond to a request
throughput – how many transactions of a given size (or range) a cluster,node or I/O subsystem can complete in a given timeframe ?
how many operations by seconds our cluster node are processing ?
But we can’t forget COST !!
How are latency and throughput related ?
theoretically, they are independent of each other.
however, change in latency can have a proportional effect on throughput
What causes a change in latency and throughput ?
Understanding performance tuning:utilization,saturation,errors,availability
What is utilization ? saturation ? errors ? availability ?
Utilization – how heavily are the resources being stressed.
Saturation – the degree to which a resource has queued work it cannot service
Errors – recoverable failure or exception events in the course normal operation
Availability – whether a given resource can service work or not
GOAL:
What is the first step in achieving any performance
tuning goal ?
setting a goal!
what are some examples of commonly heard cassandra performance tuning goals?
reads should be faster
writes to table x should be faster
the cluster should be able to complete x transactions per second
what should a clearly defined performance goal take into account ?
Writing SLA (service level agreement)
we need to know :
what is the type of operation or query ?
read or write workload
select, insert,update or delete
we need to understand latency: expressed as percentile
rank e.g 95th percentile read latency is 2 ms
throughput: operations per second
size: expressed in average bytes
We have to think about duration: expressed in minutes or hours
scope: keyspace, table, query
Example of SLA: “the cluster should be able to sustain
20000 2KB read operations per second from table X for
two hours with a 95th percentile read latency of 3 ms.”
After setting a goal, how can achievement of a goal verified?
timing tooks in your application
query tracing
jmeter test plan
customizable cassandra-stress
Time in computer performance tuning:
how long is a millisecond ?
why do we care about milliseconds ?
Common latency timings in cassandra:
  reads from main memory should take between 36 and 130 microseconds
  reads from an SSD should take between 100 microseconds and 12 milliseconds
  reads from a Serial Attached SCSI rotational drive should take between 8 milliseconds and 40 milliseconds
  reads from a SATA rotational drive take more than 15 milliseconds
Example:
Workload characterization:
classroom use case and cassandra story middle sized financial firm uses cassandra to manage distributed data 42 million stock quotes driven by a particular set of queries
what queries drove this data model ?
retrieve information for a specific stock trade by trade ID find all information about stock trades for a specific stock ticker and range timestamps find all information about stock trades that occurred on a specific date over a short period of time
How do you characterize the workload ?
what is the load being placed on your cluster
calling application or API
remote IP address
Who is causing the load ?
code path or stack trace
Why is the load being called ?
What are the load characteristics
throughput
Direction(read/write)
include variance
keyspace and column family
How do you characterize your workload ?
how is the load changing over time and is there
a daily pattern ?
is your workload read heavy or write heavy?
how big is your data ?
how much data on each node (bytes on node=data density)?
does active data fit in buffer cache ?
Performance impact of Data Model: How does the data model affect performance ?
poorly shaped rows (too narrow or too wide (we have partition to large)
hotspots (particular areas with a lot of reads/writes)
poor primary or secondary indexes
too many tombstones (lot of delete)
So data model considerations:
understand how primary key affects performance
take a look at query patterns and adjust how tables are modeled
see how replication factor and/or consistency level impact performance
change in compaction strategy can have a positive (or negative) impact
parallelize reads/writes if necessary
look at how moving infrequently accessed data can improve performance
see how per column family cache is having an impact
what is the relationship between the data model and cassandra’s read path optimizations (key/row cache,bloom filters, index) ?
nesting data (allows for greater degree of flexibility in the column family structure.) (keep all data to the same partition to satisfy a given query) but it can be easy to find model to keep most active data sets in cache, frequently accessed data which are in cache can improve performance.
Methodologies:
active performance tuning: we focus in the particular problem and we verify if it is fixed – suspect there’s a problem, isolate problem using tools, determine if problem is in cassandra ,environment or both.
verify problems and test for reproducibility,fix problems using tuning strategies, test, test and test again
Passive performance tuning : regular system “sanity checks”: looking some giving threshold,something we adjust for growth regularly monitor key health areas in cassandra/environment.
identify and tune for future growth/scalability.
apply tuning strategies as needed.
we have to use the USE Method as tool for troubleshooting
this method gives us the methodology to look for on all components of the system not only one. it is the strategy defined by Brendan Gregg http://www.brendangregg.com/USEmethod/use-linux.html.
Also performs a health check of various system components to identity bottlenecks and errors
separated by components, type and metric to narrow scope and find location of problem.
what are two things performance tuning to improve ? latency and throuput.
what are two types of performance tuning methodologies ? active and passive
what tool can be used to get a performance baseline ? jmeter or cassandra-stress
Cassandra-stress:
Interpreting the output of cassandra-stress
Each line reports data for the interval between the last elapsed time and current elapsed time, which is set by the –progress-interval option (default 10 seconds).
[hduser@base ~]$ cassandra-stress write -node 192.168.56.71
INFO  04:11:53 Did not find Netty's native epoll transport in the classpath, defaulting to NIO.
INFO  04:11:56 Using data-center name 'datacenter1' for DCAwareRoundRobinPolicy (if this is incorrect, please provide the correct datacenter name with DCAwareRoundRobinPolicy constructor)
INFO  04:11:56 New Cassandra host /192.168.56.71:9042 added
INFO  04:11:56 New Cassandra host /192.168.56.72:9042 added
INFO  04:11:56 New Cassandra host /192.168.56.73:9042 added
INFO  04:11:56 New Cassandra host /192.168.56.74:9042 added
Connected to cluster: Training_Cluster
Datatacenter: datacenter1; Host: /192.168.56.71; Rack: rack1
Datatacenter: datacenter1; Host: /192.168.56.72; Rack: rack1
Datatacenter: datacenter1; Host: /192.168.56.73; Rack: rack1
Datatacenter: datacenter1; Host: /192.168.56.74; Rack: rack1
Created keyspaces. Sleeping 1s for propagation.
Sleeping 2s...
Warming up WRITE with 50000 iterations...
Failed to connect over JMX; not collecting these stats
WARNING: uncertainty mode (err<) results in uneven workload between thread runs, so should be used for high level analysis only
Running with 4 threadCount
Running WRITE with 4 threads until stderr of mean < 0.02
Failed to connect over JMX; not collecting these stats
type,      total ops,    op/s,    pk/s,   row/s,    mean,     med,     .95,     .99,    .999,     max,   time,   stderr, errors,  gc: #,  max ms,  sum ms,  sdv ms,      mb
total,           402,     403,     403,     403,    10,4,     5,9,    31,4,    86,2,   132,7,   132,7,    1,0,  0,00000,      0,      0,       0,       0,       0,       0
total,           979,     482,     482,     482,     8,1,     6,3,    17,5,    45,9,    88,3,    88,3,    2,2,  0,06272,      0,      0,       0,       0,       0,       0
total,          1520,     530,     530,     530,     7,5,     6,4,    14,8,    24,3,   103,9,   103,9,    3,2,  0,07029,      0,      0,       0,       0,       0,       0
total,          1844,     321,     321,     321,    11,9,     6,4,    33,0,   234,5,   248,5,   248,5,    4,2,  0,06134,      0,      0,       0,       0,       0,       0
total,          2229,     360,     360,     360,    11,3,     5,4,    43,6,   127,6,   145,4,   145,4,    5,3,  0,06577,      0,      0,       0,       0,       0,       0
total,          2457,     199,     199,     199,    20,2,     5,9,    82,2,   125,4,   203,6,   203,6,    6,4,  0,11009,      0,      0,       0,       0,       0,       0
total,          2904,     443,     443,     443,     8,9,     7,0,    23,0,    37,3,    56,1,    56,1,    7,4,  0,09396,      0,      0,       0,       0,       0,       0
total,          3246,     340,     340,     340,    11,7,     7,4,    41,6,    87,0,   101,0,   101,0,    8,5,  0,08625,      0,      0,       0,       0,       0,       0
total,          3484,     235,     235,     235,    16,6,     7,2,    76,1,   151,8,   152,1,   152,1,    9,5,  0,09208,      0,      0,       0,       0,       0,       0
total,          3679,     196,     196,     196,    19,5,     8,1,    86,0,   156,5,   174,8,   174,8,   10,5,  0,09960,      0,      0,       0,       0,       0,       0
total,          4083,     369,     369,     369,    11,1,     7,3,    38,3,    90,8,   114,9,   114,9,   11,6,  0,09041,      0,      0,       0,       0,       0,       0
total,          4411,     320,     320,     320,    11,4,     7,4,    39,7,    61,1,    93,6,    93,6,   12,6,  0,08422,      0,      0,       0,       0,       0,       0
total,          4683,     227,     227,     227,    17,1,     6,0,    90,1,   153,3,   199,8,   199,8,   13,8,  0,08478,      0,      0,       0,       0,       0,       0
total,          5131,     445,     445,     445,     8,9,     7,6,    19,3,    26,8,    50,8,    50,8,   14,8,  0,07997,      0,      0,       0,       0,       0,       0
total,          5661,     521,     521,     521,     7,5,     5,4,    17,5,    63,1,    89,2,    89,2,   15,8,  0,07788,      0,      0,       0,       0,       0,       0
total,          6179,     512,     512,     512,     7,7,     6,2,    16,7,    39,3,    59,1,    59,1,   16,8,  0,07578,      0,      0,       0,       0,       0,       0
total,          6427,     245,     245,     245,    15,9,     6,1,    56,3,    94,0,   180,6,   180,6,   17,8,  0,07567,      0,      0,       0,       0,       0,       0
total,          6831,     394,     394,     394,    10,2,     5,6,    39,0,    90,4,   111,7,   111,7,   18,9,  0,07129,      0,      0,       0,       0,       0,       0
total,          7071,     235,     235,     235,    16,9,     7,4,    58,3,   149,7,   235,3,   235,3,   19,9,  0,07150,      0,      0,       0,       0,       0,       0
total,          7532,     455,     455,     455,     8,7,     6,1,    17,2,    90,5,   142,2,   142,2,   20,9,  0,06840,      0,      0,       0,       0,       0,       0
total,          7890,     353,     353,     353,    10,9,     7,3,    35,4,    80,6,   149,5,   149,5,   21,9,  0,06532,      0,      0,       0,       0,       0,       0
total,          8172,     288,     288,     288,    13,6,     7,1,    45,6,    89,1,    89,7,    89,7,   22,9,  0,06374,      0,      0,       0,       0,       0,       0
total,          8355,     171,     171,     171,    22,7,     9,1,    82,5,   137,7,   151,5,   151,5,   24,0,  0,06656,      0,      0,       0,       0,       0,       0
total,          8614,     235,     235,     235,    16,9,     8,0,    56,4,    98,7,   139,5,   139,5,   25,1,  0,06622,      0,      0,       0,       0,       0,       0
total,          9027,     402,     402,     402,     9,6,     8,5,    20,7,    26,5,    30,8,    30,8,   26,1,  0,06346,      0,      0,       0,       0,       0,       0
total,          9496,     463,     463,     463,     8,5,     7,6,    17,4,    23,2,    30,1,    30,1,   27,1,  0,06139,      0,      0,       0,       0,       0,       0
total,          9912,     408,     408,     408,     9,6,     7,5,    23,4,    33,0,    38,0,    38,0,   28,1,  0,05903,      0,      0,       0,       0,       0,       0
total,         10275,     359,     359,     359,    11,0,     8,8,    26,4,    33,7,    44,7,    44,7,   29,1,  0,05693,      0,      0,       0,       0,       0,       0
total,         10528,     251,     251,     251,    15,6,     9,5,    45,4,   176,1,   295,9,   295,9,   30,1,  0,05602,      0,      0,       0,       0,       0,       0
total,         10711,     181,     181,     181,    21,1,     7,8,    53,8,   340,8,   396,8,   396,8,   31,1,  0,05597,      0,      0,       0,       0,       0,       0
total,         10947,     233,     233,     233,    17,3,     9,3,    55,5,    94,7,   123,7,   123,7,   32,1,  0,05584,      0,      0,       0,       0,       0,       0
total,         11130,     177,     177,     177,    21,0,    10,6,    86,7,   115,6,   151,9,   151,9,   33,2,  0,05706,
...

Results:
op rate                   : 388 [WRITE:388]
partition rate            : 388 [WRITE:388]
row rate                  : 388 [WRITE:388]
latency mean              : 10,2 [WRITE:10,2]
latency median            : 7,1 [WRITE:7,1]
latency 95th percentile   : 25,9 [WRITE:25,9]
latency 99th percentile   : 71,2 [WRITE:71,2]
latency 99.9th percentile : 150,3 [WRITE:150,3]
latency max               : 396,8 [WRITE:396,8]
Total partitions          : 63058 [WRITE:63058]
Total errors              : 0 [WRITE:0]
total gc count            : 0
total gc mb               : 0
total gc time (s)         : 0
avg gc time(ms)           : NaN
stdev gc time(ms)         : 0
Total operation time      : 00:02:42
Sleeping for 15s


Data	                            Description
--------------------------------------------------------------------------------------------------
total	                           :Total number of operations since the start of the test.
interval_op_rate	           :Number of operations performed per second during the interval
(default 10 seconds).
interval_key_rate	           :Number of keys/rows read or written per second during the interval
(normally be the same as interval_op_rate unless doing range slices).
latency	Average latency            : for each operation during that interval.
95th                               :95% of the time the latency was less than the number displayed in the column
(Cassandra 1.2 or later).
99th                               :99% of the time the latency was less than the number displayed in the column
(Cassandra 1.2 or later).
elapsed	Number of seconds          :elapsed since the beginning of the test.
Cassandra tuning:
successfull performance tuning is all about understanding.
understanding what some of metrics means.
how the software which we are tuning is architecture ?
in the distributed system we have to know how the software of one node
is working together with software of others nodes ?
that is for the next section come from :
how different pieces of cassandra can be put together ?
we can be talk in about cassandra, data model.
how we can get metric and how they can be performing.
The next section, we talk about environment tuning: JVM and operating system
The next section will be focussing on disk tuning and compaction tuning
Examine cluster and node health and tuning:
Discuss table design and tuning: successfull performance tuning is all about understanding.
understanding what kind of some metrics means ? how the software which we are
tuning is architecture ? with the distributed system, we have to how the software in one node works together with the software with others nodes?
some metrics we will expose
we are talking about cassandra, data model then we will talk about the environment tuning as the JVM and the operating system, also we will discuss disk tuning and compaction tuning
let’s talk about cluster and node tuning:what activities are in a cassandra cluster
happen between nodes ?
what happening on the network ? when we dig into some performance problem, we will look into all nodes not only one:
answers are: coordinator,gossip,replication,repair,read repair,bootstrapping,
node removal, node decommissioning.
we have to dig not only one node but additional node
Deeling in one node, whay does a cassandra node do ? read performance, write,
monitor,participate in the clusters, maintain consistency.
internally cassandra has lot of things to do, there is a architecture that
how is it organize ? how does cassandra organize all of that work ?
the answer of this is SEDA (staged event driven architecture), so we have
several thread pool and the messaging service to know how the queue works.
What is a thread pool ?
example, we have thread pool:workers:6
                                                                                              worker thread
  task          queue:max pending tasks:7                worker thread
  task task  task task  task  task task task task =>     worker thread
  task                                task               worker thread
  blocked tasks
what are cassandra’s thread pools ?
read readstage:32
write (mutationstage,flushwriter,memtablepostflusher,countermutation,
migrationstage)
monitor (memorymeter:1,tracing)
participate in cluster (requestresponsestage:%CPUs,pendingrangecalculator:1,gossipstage:1)
maintain consistency(commitlogarchiver:1,miscstage:1 snapshoting/replicate data after node remove)
antientropystage:1 repair consistency – merkle tree build,internal responsestage:#CPUs,HintedHanoff:1,readrepairstage:#CPUs)
we will know , for example the single thread on monitor (memorymeter:1)
which one has the configurable number of threads ? its read (readstage:32*)
the utility like nodetool tpstats which can give us metrics inside into , how much work each these pools are doing ? how many appending, active blocks:
active – number of messages pulled off the queue,currently being processed by a thread.
pending – number of messages in queue waiting for a thread.
completed – number of messages completed.
blocked -when a pool reaches its max thread count it will begin queuing.
until the max size is reached. when this is reached it will block until there is room in the queue.
total blocked/all time blocked – total number of messages that have been blocked.
cassandra thread pools: multi-threaded stages:
readstage (affected by main memory,disk) -perform local reads
mutationstage (affected by CPU,main memory,disk) – perform local insert/update,
schema merge,commit log replay,hints in progress)
requestresponsestage (affected by network,other nodes) – when a response to a request is received this is the stage used to execute any callbacks that were created with the original request.
flushwriter (affected by CPU,disk) -sort and write memtables to disk
hintedhandoo (one thread per host being sent hints,affected by disk,network,others nodes) –
sends missing mutations to others nodes
memorymeter (several separate threads) – measure memory usage and live ratio of a memtable.
readrepairstage (affected by network,others nodes) -perform read repair
countermutation (formerly replicateOnWriteStage) -performs counter writes on non-coordinator nodes and replicates after a local write
internalresponsestage -responds to non-client initiated messages, including bootstrapping and schema checking.
single-threaded stages:
gossipstage (affected by network) – gossip communication
antientropystage(affected by network,other nodes) – build merkle tree and repair consistency
migrationstage(affected by network,other nodes) – make schema changes
miscstage (affected by disk,network,pthers nodes) – snapshotting,replicating data after node remove
memtablepostflusher (affected by disk) -operations after flushing the memtable.
Discard commit log files that have all data in them persisted to sstables.
flush non-column family backed secondary indexes
tracing -for query tracing
commitlogarchiver (formally commitlog_archiver) -back up or restore a commit log.
Messages types:
handled by the readstage thread pool
(read: read data from cache or disk,range_slice: read a range of data,paged_range:
read part of a range of data)
)
handled by the mutationstage thread pool: (mutation:write (insert or update) data,
counter_mutation:changes counter columns,read_repair:update out-of-sync data discovered during a read)
handled by readresponsestage:(request_response:respond to a coordinator,_trace:
used to trace a query (enable tracing or every(trace probability) queries)
binary:deprecated
Question:why are some messages types “droppable” ?
if the message set in one of the queue to long and the to long will be decide by the timeout by the cassandra.yaml, it will be dropped.
why cassandra will do that ? why cassandra does not do my work ?
if the node has a suffisant resource to do the job, it does not dropped it.
in practice, if i have a read to give to cassandra and the timeout is elapsed and it timeout. what does the coordinator in this situation do ? it depends, maybe it can be satisfy by the consistency level to another node, then the consistency level gives the query or the return the timeout then back to the client if it is the to high consistency level.
In the read, there is not the deal, usally we can reexecute the query.
however we have another mutation (insert/delete/update) they can be to the queue to long (2 seconds) then no thing is done,
so what happen ? the coordinator can be experienced the
timeout, may be it store the hint, may be it can be back to the driver to be retry, we
don’t know, but the important thing some recovery actions can be taking in this point.
still that node who has a write doesn’t perform, that thing like read repair or repair command can back result to the client
why are some messages types “droppable”
some messages can be dropped to prioritize activities in cassandra when high resource contention occurs.
the number of these messages dropped is in the nodetool tpstats output
if you see dropped messages, you should investigate.
Question:What is the state of your cluster ? we have nodetool to gather information on our cluster or OpsCenter to gather information on our cluster.
nodetool gives us informations what happen right now, it is cummulatitve
but we do not know what happen last second,it is good for a general assessment
and also for comparaison between nodes (nodetool -h node0 tpstats, nodetool -h node0 compactionstats)
nodetool -h node0 netstats (we have to look for repair statistics) read repair
is when we are looking for discrepancy and if we find discrepancy between nodes, we will fixed by increasing cch (blocking), another read repair is the background, if we run the query probably consistency level 1 and we return no response, if we get a discrepancy. then we will increase the cch (background).
too wide: We have partition too large
too narrow:partition is to small and our query takes row on all bunch of partition
hotspots: we have a customer who decides to design partition by country code then 90% of all rows are in US and the rest on all others countries
poor primary and secondary indexes:
too many tombstones: we have a workload doing a lot of deleting and then reading data around the same partition, those things can have a huge impact on read performance.
OpsCenter
Changing logging levels with nodetool setlogginglevel:
nodetool getlogginglevels: use to get the current runtime logging levels
root@ds220:~# nodetool getlogginglevels
Logger Name                                                                 Log Level
ROOT                                                                        INFO
DroppedAuditEventLogger                                                     INFO
SLF4JAuditWriter                                                            INFO
com.cryptsoft                                                               OFF
com.thinkaurelius.thrift                                                    ERROR
org.apache.lucene.index                                                     INFO
org.apache.solr.core.CassandraSolrConfig                                    WARN
org.apache.solr.core.RequestHandlers                                        WARN
org.apache.solr.core.SolrCore                                               WARN
org.apache.solr.handler.component                                           WARN
org.apache.solr.search.SolrIndexSearcher                                    WARN
org.apache.solr.update                                                      WARN
nodetool setlogginglevel: used to set logging level for a service can be used instead of modifying the logback.xml file possible levels:
ALL
TRACE
DEBUG
INFO
WARN
ERROR
OFF
we can increase the level logging for example for namespace only to DEBUG or even TRACE
Data Model Tuning:
One off the key component of cassandra is the data model.
for performance tuning, we have the workload which place on the database. it is in the given place on cassandra table, that where the data model come .then we have software tuning (OS,JVM, Cassandra) and Hardware.
in many cases, updating hardware is an option.
When we need to diagnose the data model, cassandra provides many tools to know how our table is performing, how the query is performing.
Here is one nodetool cfstats, additionaly nodetool cfhistograms
when we identify the query which we may suspect, we have CQL tracing but we also have nodetool settraceprobability
nodetool cfstats example: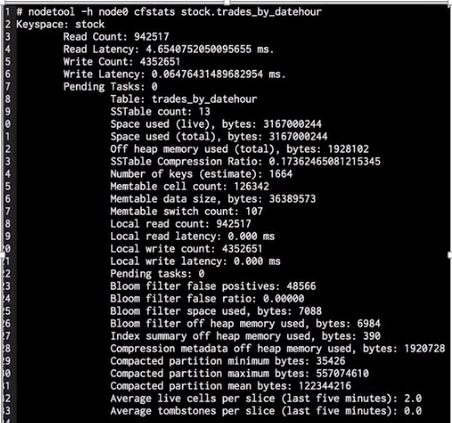
This one below is the aggregate number of the keyspace not for this particular table:
Then below the aggregate number of the table stock only: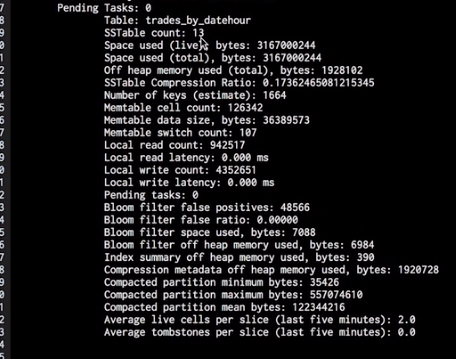
Here we have 13 sstable on the disk for this table.
How much data we are store on the disk with the metrics space used? in this case we have live bytes and the total bytes is the same, that means in this particular table, we don’t have delete, ever update only insert ,however, if I do some delete or update, we will see the difference between live and total space used, the total number will be bigger than the live.
Off heap memory used (1928102) shows us how many memory this table are using. We have also other couple of metrics as bloom filter space used, bytes: 7088, and Bloom filter off heap memory used, bytes: 6984, we also have Index summary off heap memory used: 390, and compression metadata off heap memory used, bytes : 1920728, and memTable data size, bytes (36389573)
Conclusion: If I look at these numbers:
1928102 + 7088 + 6984 + 1920728 +36389573=40252475 bytes (39 MB)
I can know how much memory of ram are consuming by this table.
SSTable compression ratio: 0.173624: if I enable the compression like here. We have 17 % of compression of this table.
Number of keys: 1664 this is counting just the partition, so if we have a simple table schema , only have a partition key no cluster column , this number (1664) will be a rough number of rows on a given server.
These all metrics can be different on every server, so we have to go on each server to look at.
Memtable cell count (126342), memTable data size, bytes (36389573) and memTable switch count (107). MemTable data size (36389573) , this is a data which is storing in memory currently and they will go to flush on the disk. For memTable switch count, every time I flush memTable data to disk, this metric will increase. Memtable cell count indicates how many cell we have in memory.if we divide that by column count looking in schema definition (example 5 columns), 126342/5 = 25268,4, we can know approximativement the number of rows because Cassandra stores cell else the rows.
Local read count, local read latency, local write count and local write latency show us metrics read, write for this particular table. Local read count and local write count give us the indication to know if we have read heavy or write heavy. For our example, we have write heavy (4352651 greater than 942517).
Pending tasks: 0 this is counting any tasks pending, we saw that earlier on the tpstats.
Bloom filter false positives, bloom filter false ratio, bloom filter space used, bytes, bloom filter off heap memory used,bytes: the main metric here is the false ratio (0.0000) that takes the number of bloom filter false positives (48566) divided by the number of local read count (942517) , that can give us the false ratio. What did we pay to get 48566 of bloom filter false positives to get 942517 local read count? We paid these memory ram bloom filter space used, bytes: 7088 plus bloom filter off heap memory used, bytes: 6984, total of these memories: 7088 + 6984 =14072 bytes approximatively: 14 KB of RAM to get false positives to avoid unnecessary disk seek. If it is unacceptable, we can tune it by paying more memory and to get lower false positives and consequently less fewer unnecessary less disk seek, so read performance will go UP.
Index summary off heap memory used, bytes: 390: Is a memory structure we use to help us to jump to correct place in the partition index in memory. In this case we paid 390 bytes of memory that is tunable also but in Cassandra 2.1 we cannot adjust it automatically.
Compression metadata off heap memory used, bytes: 1920728 bytes, it is the amount of ram consume for compression. We can look at also.
Compacted partition minimum bytes, compacted partition maximum bytes, compacted partition mean bytes: very useful metrics for getting indication for how we have setup our partition. What I mean by that ? if we look at compacted partition minimum bytes (35426 bytes = 35 KB) and compacted partition mean bytes (122344216 bytes =116.68 MB) and we look at the maximum bytes (557074610 bytes =531,28 MB), we have the idea of the distribution of the size of the partition. If we look at the number of means bytes (122344216 bytes =116.68 MB), there is a huge discrepancy between the min and the max, probably we have the good indication of the hotspot of the data , the partition is abnormally much larger than the other partitions.
Average live cells per slice, average tombstones per slice: these metrics are only useful on production.
Average live cells per slice (last five minutes): 2.0: it has been reading on average 2.0 and 0.0 for tombstones, that good. If it is for example 2.0 for tombstones, that means for every 2.0 last five minutes for read, probably it pick at 2.0 tombstones that gives 50% over read performance to tombstones. Unfortunately, this number of tombstones cannot be the same. That the good indication that we have exception large delete of data.
For all these metrics we have some tunable.
Notes:
The bloom_filter_fp_chance and read_repair_chance control two different things. Usually you would leave them set to their default values, which should work well for most typical use cases.
bloom_filter_fp_chance: controls the precision of the bloom filter data for SSTables stored on disk. The bloom filter is kept in memory and when you do a read, Cassandra will check the bloom filters to see which SSTables might have data for the key you are reading. A bloom filter will often give false positives and when you actually read the SSTable, it turns out that the key does not exist in the SSTable and reading it waste the time. The better the precision used for the bloom filter, the fewer false positives it will give (but the more memory it will need).
From the documentation:
0 Enables the unmodified, effectively the largest possible, Bloom filter
1.0 Disables the Bloom Filter
The recommended setting is 0.1. A higher value yields diminishing returns.
So a higher number gives a higher chance of a false positive (fp) when reading the bloom filter.
read_repair_chance: controls the probability that a read of a key will be checked against the other replicas for that key. This is useful if your system has frequent downtime of the nodes resulting in data getting out of sync. If you do a lot of reads, then the read repair will slowly bring the data back into sync as you do reads without having to run a full repair on the nodes. Higher settings will cause more background read repairs and consume more resources, but would sync the data more quickly as you do reads.
See documentation on this link: http://docs.datastax.com/en/cql/3.1/cql/cql_reference/tabProp.html
You can read also this document:
http://www.datastax.com/dev/blog/common-mistakes-and-misconceptions
Here is the description of that table: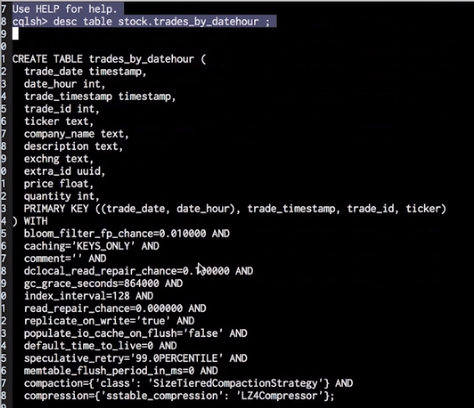
Below we have tunable parameters for this table: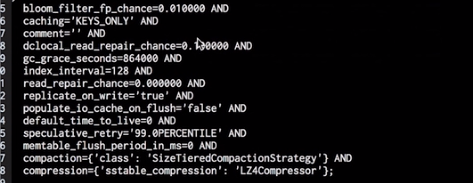
These parameters influence directly the metrics we saw earlier.
Example:
bloom_filter_fp_chance=0.010000, that impact how many false positives we got and how much memory were are going to give up to low or high.
caching=’KEYS_ONLY’: In this case it is key only, we just go to cache only key but we have the ability to cache rows cache , so we will increase the memory utilization of this table, that also have the big impact.
dclocal_read_repair_chance=0.100000 and read_repair_chance=0.00000: these parameters influence the no blocking shows in tpstats.
gc_grace_seconds=864000: it impacts the tombstones, how long we can hold on the tombstones but it impacts the last line we saw earlier (average tombstones per slice (last five minutes), so it is tunable.
index_interval=128: in Cassandra 2.1, a max and min interval, those will impact index summary off memory used, bytes saw earlier. That is tunable.
Populate_io_cache_on_flush=’false’: in Cassandra 2.0 it allows us to populate if we want to flush to disk and say.
MemTable_flush_period_in_ms=0 if we want to flush on the disk by scheduling, most people do that.
Compression= {‘sstable_compression’:’LZ4compressor’}: that can be impact the compression ratio we saw early. If we want, we can tune off the compression. Why do we change that? May be we have the high compression ratio probably trading off CPU cycle, we can change it.
Speculative_retry=’99.0PERCENTILE’: this is not impacting in the tpstats output. When we are performing a read, we have additional replicat could be used to feel the request, Cassandra will wait for this long 99.0 % , if it is the quorum read each replicat will go to ask others replicat to get the data , Cassandra will wait this long 99.0 PERCENTILE in terme in milliseconds.
NODETOOL CFHISTOGRAMS:
Let‘s go to node0 cfhistograms: in Cassandra 2.0, it is pretty long, it gives us very fine bucket. Also we have a new format for percentile sstables writes latency ,read latency , partition size , cell count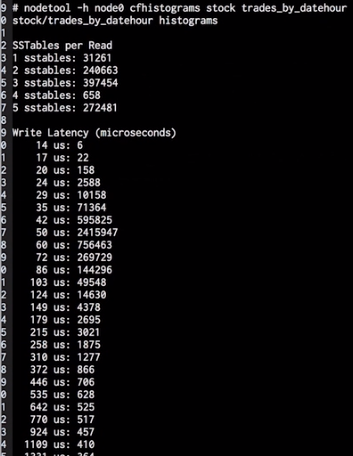

How do we read us?
sstables per read:
31261 read will be satisfy by only one sstable but we have 240663 read operations will be satisfy by adding another sstable, that two disk seeks so the performance is there, then when we go down here, we have 397454 read operations by adding another sstables, we have three sstables, that three disk seeks. When we go, the slow the performance get, we have the performance problem,we need to get inside to know how it is performing.
Generally if we have this problem, it usually the function of compaction that getting behind. Compaction is the low priority task, it contains disk io, we don’t do that when we have a huge activity on the cluster.
Consequence: we have to read on the sstables to satisfy more read.
We see here on the five sstables we have 272481 read operations to satisfy read that is the problem.
Next is the write latency: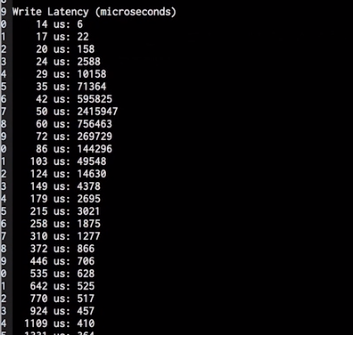
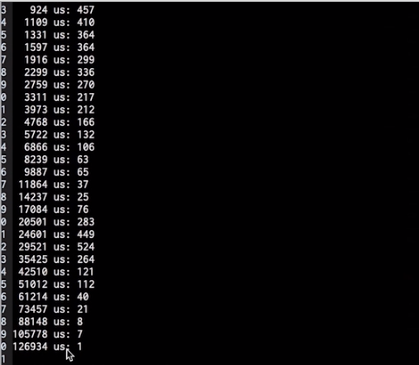
We saw in cfstats, local read latency: 0.000 ms and local write latency: 0.000 ms.
In write latency, us is the microseconds, here we see 2415947 writes operations will be completed in 50 us (microseconds) , this is the buck, my write operations completed in 50 us, so we have a long tail , then when we come down on write latency, the max was 126934 us:1
For the read latency, 50 us (microseconds) of read operations has 12976, this is a buck for read operations .this is proof that with Cassandra write latency is much much lower than read latency.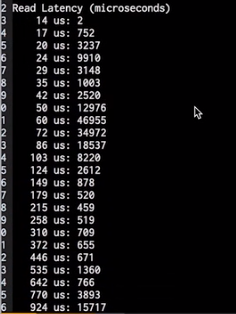
Another trend is the notion of two bumps:
Here is the first bump: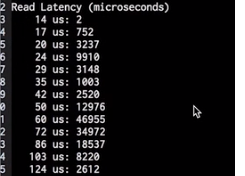
Second bump: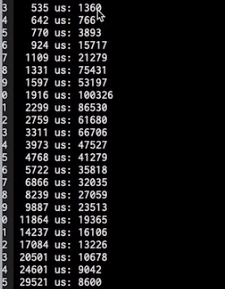
This is an indication of read from ram for the first bump and read from disk for the second bump.
Partition size:
So we have fine great output for partition size, these data generally is representative of cfstats by the metrics follow (compacted partition minimum bytes, compacted partition maximum bytes and compacted partition mean bytes).
We can see here we have one partition with 42Kb and at the end my largest has 25109160 bytes (24MB). 0, 1, 2 mean we create the bucket.
Cell count per partition:
Sometimes people have large volume of data in each cell this definitively influence number of partition size but we have a large data and the small number of cells (0, 1, 2) . Combining information below with which we saw on the partition size, we can see how the data is lay out on the term of data model. That is looking at the table schema

So this line means 3 of my partition have 4866323 cells
Quiz:
Which of the following information does CQL display for a query trace? Elapsed time
Which of the following components would you not find statistics for in a nodetool cfstats output? row cache
nodetool cfhistograms shows per-keyspace statistics for read and write latency? false only for the table.
Environment Tuning:
Some we have to tune others components. For example:
The most common bottlenecks in Cassandra? Performance checkpoint, things that slowing down the performance of the system.
The most common bottlenecks are:
Inadequate hardware.
Poorly configured JVM parameters: Cassandra runs on top on this virtual machine.
High CPU utilization: Particularly for write workload which we can see the Cassandra CPU bond, CPU pick..
Insufficient or incorrect memory cache tuning: This referring for read. This point is very outside of Cassandra.
I like to drive this point.
Question: What is the best way to cope with inadequate node hardware in a Cassandra cluster?
Lot of people ask, we have a machine then we want the performance then what can we do?
Upgrade the hardware. This is the bad new.
If we don’t get adequate equipment for the job, it is not a good idea to do the job.
We could say to add another node if the existing machine not performing.
What are some of the technologies upon which a Cassandra node depends?
Java, JVM, JNA, JMX and a bunch of others stuff that starts with “j”
JVM:
Cassandra is the java program, we will know how the jvm works, so we can tune it.
When we can for tuning, JVM has a lot options.
If we run this command:
java -XX:+PrintFlagsFinal
We will see all of the options.
JVM and Garbage Collection (GC): what is Garbage collection? Java gives the developer to allocate and deallocate memory. Java can complain all of the resources on the machine, lot of ram, CPU, IO.
JVM generational Heap:
When we start the java process, jvm will allocate a big chunk of ram and that is the chunk will be managed can be half. Inside that chunk this is a heap, it divides in several pieces, we have the new gen, old gen and perm gen. after java 8, perm gen change. What is does? It stores all of classe definitions.
Important thing that Cassandra boot load all code in most part of perm gen which could not change in size.

With Cassandra, we can do anything in perm gen.
But in New gen, we have Eden and survival spaces. So, when we create a new objects any kind of objects, that object will be created in Eden. Let say we created it inside the function then it will be created in the Eden and as the space of eden fills Up with objects allocations that can the garbage collection kik send , that the first garbage collector.
This piece (new gen) is called parallel new.
Important thing is if Eden fills up, we need to look for garbage, we will find and drop all objects which will not references and deallocate them. However, there will be others objects which are always references, they can be move to survival area in New gen.
And after the survival, this process could be promoted to Old gen.
There are lot of options to do how many time the objects can be on Eden or to be move to survival and also to Old gen. Lot of options.
This are (old gen), can be fill up with the options.
Take a look at this.
I have in my test cluster, 4 nodes working in different virtual machine.
nodetool status
[hduser@base cassandra]$ nodetool status
Datacenter: datacenter1
=======================
Status=Up/Down
|/ State=Normal/Leaving/Joining/Moving
--  Address        Load       Tokens       Owns    Host ID                               Rack
UN  192.168.56.72  40.21 MB   256          ?       5ddb3532-70de-47b3-a9ca-9a8c9a70b186  rack1
UN  192.168.56.73  50.88 MB   256          ?       ea5286bb-5b69-4ccc-b22c-474981a1f789  rack1
UN  192.168.56.74  48.63 MB   256          ?       158812a5-8adb-4bfb-9a56-3ec235e76547  rack1
UN  192.168.56.71  48.52 MB   256          ?       a42d792b-1620-4f41-8662-8e44c73c38d4  rack1
Now we can do the command:
cassandra-stress write -node 192.168.56.71
Result:
INFO 23:56:42 Using data-center name 'datacenter1' for DCAwareRoundRobinPolicy (if this is incorrect, please provide the correct datacenter
name with DCAwareRoundRobinPolicy constructor) INFO 23:56:42 New Cassandra host /192.168.56.71:9042 added INFO 23:56:42 New Cassandra
host /192.168.56.72:9042 added INFO 23:56:42 New Cassandra host /192.168.56.73:9042 added INFO 23:56:42 New Cassandra host /192.168.56.74:9042
added Connected to cluster: Training_Cluster Datatacenter: datacenter1; Host: /192.168.56.71; Rack: rack1 Datatacenter: datacenter1;
Host: /192.168.56.72; Rack: rack1 Datatacenter: datacenter1; Host: /192.168.56.73; Rack: rack1 Datatacenter: datacenter1; Host: /192.168.56.74;
Rack: rack1 Created keyspaces. Sleeping 1s for propagation. Sleeping 2s... Warming up WRITE with 50000 iterations... Failed to connect over JMX;
not collecting these stats WARNING: uncertainty mode (err<) results in uneven workload between thread runs, so should be used for high level
analysis only Running with 4 threadCount Running WRITE with 4 threads until stderr of mean < 0.02 Failed to connect over JMX; not collecting
these stats type,
total ops, op/s, pk/s, row/s, mean, med, .95, .99, .999, max, time, stderr, errors, gc: #, max ms, sum ms, sdv ms, mb
total, 2086, 2086, 2086, 2086, 1,9, 1,5, 4,2, 7,0, 46,4, 58,0, 1,0, 0,00000, 0, 0, 0, 0, 0, 0
total, 4122, 2029, 2029, 2029, 2,0, 1,6, 4,8, 8,0, 14,0, 15,3, 2,0, 0,02617, 0, 0, 0, 0, 0, 0
total, 6171, 2029, 2029, 2029, 1,9, 1,5, 5,1, 7,6, 12,0, 13,6, 3,0, 0,02038, 0, 0, 0, 0, 0, 0
total, 8466, 2288, 2288, 2288, 1,7, 1,4, 4,2, 6,1, 11,9, 14,4, 4,0, 0,02715, 0, 0, 0, 0, 0, 0
We can run the program called jvisualvm
If we have the JDK installed this java visual vm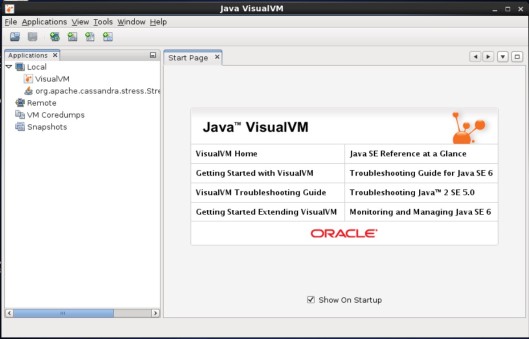
We can see the available plugins on the Tools windows and activate some plugins like VisualVM-Glassfish, visual GC: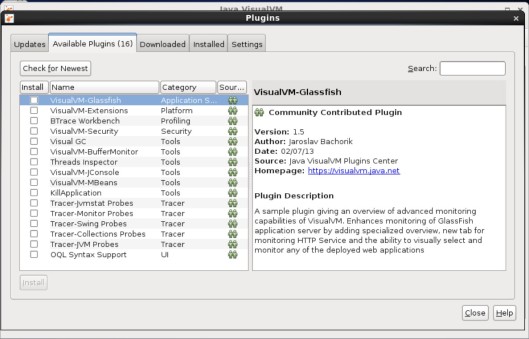
We can see the Eden space: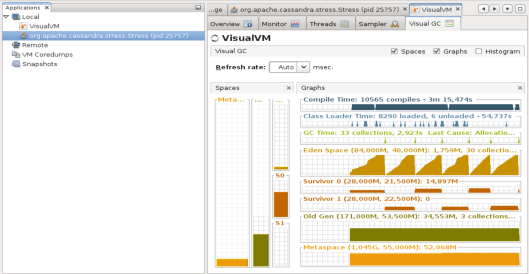
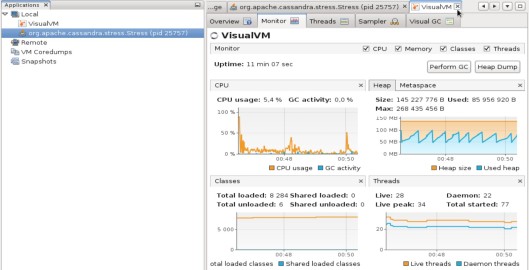
In the long time, Cassandra recommended the CMS collector. In java 7, G1 exist and in java 8 it is very good.so depending of the version of Cassandra which you are running, it will be CMS or G 1.
CMS and G1 have both old generation and the permanent generation.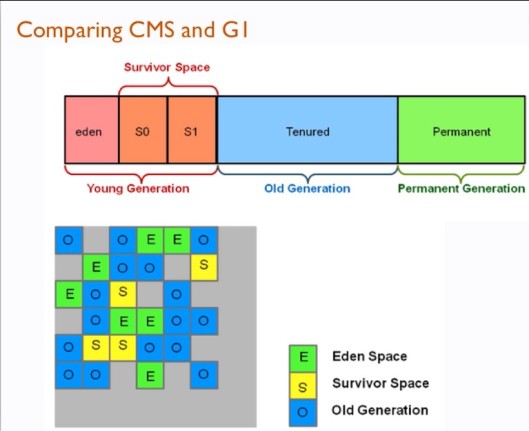
The difference is in G1 we have several contigus chunk of memory like this:
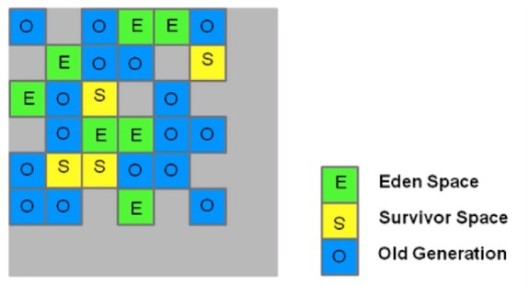
G1 is very very well with very large heap. We generally recommend 8 GB heap for Cassandra.
When the old gen fill up we can have the capacity and we do a merging garbage collection, this pause time could last for second. That bring the pausis. What is the notion of pausis ?when we are doing the garbage collection in CMS or G1, some part of have to do the stop the work pause, that where they stop our program running at all and in eden and survivor space to find any unnecessary objects so we can clean them up.
How long this pause is last? is the function of couple of different things
How many objects are still in live?
The number of CPU available to the jvm is also the big determine. How long the garbage collection pause there
Additionally CMS offers one of the other thing called the heap fragmentation. Any way CMS defragment those is to do that the full stop the wall pause by the serial collector which is another garbage collection but it is single threaded. That the extreme long pause come from.
For G1 the only option we have is the target pause time and the minimum is 12 hundred milliseconds.
We have a couple of tools available:
1. java visual vm
3. Jconsole and jvisualvm
jstat -gccause 1607 5000 (1607 is the process id for Cassandra)
Notes:
The most significant impact for Java virtual machine on Cassandra performance is Garbage collection.
The G1 collector is the preferred choice for garbage collection over CMS.
Metaspace does NOT exist in the new generation part of the JVM heap memory.
JVM Tools and Tuning Strategies:
If we have the server with 126 GB of RAM, it starts Cassandra by allocated 8 GB heap, what are it doing of the rest of the memory?
Page cache.
What is page caching? This is useful for Cassandra improving read performance. it can cache data that people are accessing frequently and get it up quicker than in the disk.
[hduser@base ~]$ free -m
             total       used       free     shared    buffers     cached
Mem:          5935       4271       1664         13        104       1189
-/+ buffers/cache:       2977       2957
Swap:         2047          0       2047
Here we have 5935 MB of ram but 4271 MB are used, so only 1189 MB are cached.
How does Cassandra utilize page caching?
It also make a write efficient but it cannot improve a lot write.
How do you triage root cause for out of memory (OOM) errors? If we don’t have enough memory.
It can be java errors not only Cassandra.
All of the challenge can be to buffering data in case of writing. It tries to write data in disk
Quiz:
What is the benefit of using the page cache? Reads are more efficient, Writes are more efficient, and Repairs are more efficient
Memory used by the page cache will not be available to other programs until explicity freed. ? true
Which of the following is most likely to cause an out-of-memory error? Client-side joins
CPU
CPU intensive:
Writes (INSERT, UPDATE, DELETE), encryption, compression, Garbage collection is CPU-intensive.
The more CPU which you can give to garbage is the faster garbage collection will run.
If you want to activate the compression or the encryption, you have to monitor the CPU utilization with the tools like dstat or opscenter.
What to do ?
Add nodes
Use nodes that have more and faster CPUs
However, if you have saturation of the CPU, we have a couple of options:
1. Turn off encryption, turn off compression
2. Add nodes
3. Alternatively upgrade theses nodes with more CPU
Quiz:
Which of the following operations would significantly benefit from faster CPUs? Writes and Garbage collection
OpsCenter is a tool that can be used to monitor CPU usage ? true
What would be the best course of action to resolve issues with CPU saturation? Add more nodes.
Disk Tuning:
In this section we are going to talk about disk tuning and compaction.
Question: How do disk considerations affect performance?
When we operate in the database like Cassandra where we have active dataset that have a large available RAM, disk. So, we have to take these things into account.
SSD: spinning, or rotation, disks must move a read/write mechanical head to the portion of the disk that is being written to or read.
Cassandra is architecture around rotation drive with sequential write and sequential read. However, SSD is very faster. If you have a latency application, SSD is crutial.
Some of the tuning in the Cassandra.yaml file that affect disk are:
Configuring disks in the Cassandra.yaml file:
1. Disk_failure_policy: what should occur if a data disk fails? Not for performance.
• By default, we do stop which Cassandra can detect some kinds of corruption, shut down gossip and thrift.
• Best-effort -stop using failed disk and respond using remaining sstables on others disks -obsolete data can be returned if the consistency level is one
• Ignore -ignore fatal errors and let requests fail
2. Commit_failure_policy: – What should occur if a commit log disk fails?
• Stop -same as above
• Stop_commit – shutdown commit log, let writes collect but continue to serve reads
• Ignore -ignore fatal errors and let batches fail
3. Concurrent_reads -typically set to 16 * number of drives: how many threads we can allocate for reads pool
4. Trickle_fsync -good to enable on SSDs but very bad for rotation drive. In SSD, it will do big flash
Tools to diagnose relative disks issue:
Using Linux sysstat tools to discover disk statistics:
System activity reporter (sar) -can get information about system buffer activity, system calls, block device, overall paging, semaphore and memory allocation, and CPU utilization.
Flags identify the item to check:
sar  -d for disk
sar  -r for memory
sar  -S for swap space used
sar  -b for overall I/O activities
dstat  -a Leatherman tool for Linux -versatile replacement
for sysstat (vmstat, iostat, netstat, nfsstat, and ifstat)
with colors
Flags identify the item to check:
dstat      -d             for disk
dstat      -m             for memory, etc
Can also string flags to get multiple stats:
dstat -dmnrs
Step to install dstat on RHEL/CentOS 5.x/6.x and fedora 16/17/18/19/20:
Installing RPMForge Repository in RHEL/CentOS
For RHEL/CentOS 6.x 64 Bit
sudo rpm -Uvh http://pkgs.repoforge.org/rpmforge-release/rpmforge-release-0.5.3-1.el6.rf.x86_64.rpm
sudo yum repolist
sudo yum install dstat
If we want to use linux script to monitor our statistics, we can use cron jobs like:
sudo dstat -drsmn --output /var/log/dstat.txt 5 3 >/dev/null
#!/bin/bash
dstat -lrvn 10  --output /tmp/dstat.csv -CDN 30 360 mutt -a /tmp/dstat.csv  -s "dstat report"  me@me.com >/dev/null
- load average (-l), disk IOPS(-r) ,vmstat(-v), and network throughput(-n)
Output can be displayed on webpage for monitoring
Output could be piped into graphical programs, like Gnumeric, Gnuplot, and Excel for visual displays.
- memory should be around 95% in use ( most of it in of cache memory column).
- CPU should be <1-2% of iowait and 2-15 % system time.
- Network throughput should mirror whatever the application is doing.
Another tool is: nodetool cfhistograms to discover disk issues:
For SSD disk io disk performing, this tool can tell us something. The problem could be the JVM, the size of the RAM, there are a lot of thing it could be but disk is one of the things it could be.
With cfhistograms, there are two groups of bumps. It could be 1 of three things, usually we see two bumps.
One relative to read coming from RAM and big one coming from disk. Sometimes, it could be anything else like a lot of compaction. Compaction can cause disk contention and this contention can cause the read disk goes UP. because the compaction uses the disk by reading.
So, how do we deep that? How to fix it?
We have the utility Throttle down compaction by reducing the compaction_throughput_mb_per_sec.
Using nodetool proxyhistograms to discover disk issues: will show the full request latency recorded by the coordinator.
Using CQL TRACING :
To distinguish between slow disk response and slow query: slow disk response will be evident in how long it takes to access each drive.
If your queries need to look for SSTables on too many partitions to complete, you will see this in the trace
These issues will have different patterns.
Here we can see lot off informations like looking on the tombstoned, etc. We can know if our latency on the query is coming from the disk.and it shows us the source on which machine is experiencing those longer latencies.
Where is tracing information stored?
events table gives us lot of relative details for this particular query.
What role does disk readahead play in performance? We read a head a couple of blocks and that tunable, how many blocks to read a head? The problem is in Cassandra we don’t know exactly how much data we want to read a head
We recommend people to use readahead value of 8 for SSDs
Command to do that is:
blockdev -setra 8
QUIZ:
nodetool cfhistograms shows the full request latency recorded by the coordinator.false
Which of the following statements is NOT true about the readahead setting?
Which of the following tools can be used to monitor disk statistics? iostat, dstat, sysstat, sar.
Disk Tuning:
Compaction
How does compaction impact performance?
Compaction is the most io intensive operation in Cassandra cluster. So, some of the choice we make around is our compaction strategies and how we throllet, some things happen on the disk, how the big impact on the disk utilization in our cluster.
ction Strategy DTCS for the time series data model.
Adjust compaction is to look at the impact of min/max SSTable thresholds.
Understand the connecUnderstand compaction strategies: there are 3 currently (SizeTiered Compaction Strategy STCS, DateTiered Compaction Strategy DTCS, Leveled Compaction Strategy LTCS)
For write and intensive workload, SizeTiered Compaction Strategy STCS can be the best.
Leveled Compaction Strategy is generaly recommended for read and workload only if we are using SSDs.
DateTiered Compation between number of SSTables and compaction as it affects performance
See what options are available for compaction to improve performance
How do tombstones affect compaction?
Compaction evicts tombstones and removes deleted data while consolidating multiple SSTables into one. More tombstones means more time spent during compaction of SSTables.
Once a column is marked with a tombstone, it will continue to exist until compaction permanently deletes the cell. Note that if a node is down longer than gc_grace_seconds and brought back online, it can result in replication of deleted data -zombie!
To prevent issues, repair must be done on every node on a regular basis.
Best practices: nodes should be repaired every 7 days when gc_grace_seconds is 10 days (the default setting)
How data modelling affects tombstones?
If a data model requires a lot of of deletes within a partition of data then a lot of tombstones are created. Tombstones identify stale data awaiting deletion – which data will have to be read until it is removed by compaction.
More effective data modelling will alleviate this issue. Ensure that your data model is more likely to delete whole partitions, rather than columns from a partition.
The data model has a significant impact on performance. Careful data modelling will avoid the pitfalls of rampant tombstones that affect read performance.
Tombstones are normal writes but will not otherwise affect write performance.
If you know you do a lot of delete you discover to do a long delete which will affect read performance we probably need to do something to fix it, example changing a data model or the way our workload use this data model.
Using nodetool compactionstats to investigate issues:
This tool can be used to discover compaction statistics while compaction occurs. Reports how much still needs compacting and the total amount of data getting compacted.
But by using CQL tracing to investigate issues, we can see how many nodes and partitions are accessed.
The number of tombstones will be shown.
The read access time can be observed as decreasing after a compaction is complete. It can also be seen to take longer while a compaction is in progress.
Why is a durable queue an anti-pattern that can cause compaction issues?
A lot people for another reason like to use Cassandra for durable queue because of this problem of tombstones, this is a use anti pattern. Generally what happen, only reading and delete on the same place then read performance can grow up. If you try to corrige a queue use a queue, use something like KAFKA that the perfect durable queue. Cassandra is not a tool to use as a queue.
How do disk choices affect compactions issues?
Compaction is the most disk IO with intensive operation of Cassandra performance.so having a good disks has a good positive affect on it. Conversely, have a slow disks can have a very detrimental effect on it. When you have compaction going very slow, you can increase SSTable for read then read performance can suffer.
Use nodetool cfhistograms to look at the read performance.
QUIZ:
Which of the following compaction strategies should be used for read-heavy workloads, assuming certain hardware conditions are met? Leveled Compaction
What tool, command, or setting can be used to investigate issues with tombstones? CQL tracing
Compaction can potentially utilize not only a significant amount of disk I/O, but also disk space as well.true
Disk Tuning: Easy Wins and Conclusion:
To end this paper, we need to revisit:
• Performance tuning methodology
• Outline easy performance tuning wins
• Outline Cassandra or environment anti-patters
How does this all fit together?
1. We need to understand performance and Cassandra at the high level. That is general performance tuning techniques and some of the terminology as well as how Cassandra itself works.
2. Collect performance data on the following things to know where to look for data and what that data means in term of tuning or isolation problem:
• workload and data model
• cluster and nodes
• operating system and hardware
• disk and compaction strategies.
3. Parsing the information gathered and begin formulating a plan:
• Based on metrics collected, where are the bottlenecks?
• What tools are available to fix issues that come up?
4. Apply solutions to any/all areas required and test solutions:
• Using tools and knowledge gained, apply solutions, test solutions applied and start cycle again as needed.
Question: What was that performance tuning methodology again?
We have:
Active performance tuning – suspect there’s a problem?
• Determine if problem is in Cassandra, environment or both.
• Isolate problem using tool provided.
• Verify problems and test for reproductibility.
• Fix problems using tuning strategies provided.
• Test, test, and test again.
• Verify that your “fixes” did not introduce additional problems.
Passive performance tuning – regular system “sanity checks”
• Regularly monitor key health areas in Cassandra / environment using tools provided.
• Identify and tune for future growth/scalability.
• Apply tuning strategies as needed.
• Periodically apply the USE Method for system health check.
Easy Cassandra performance tuning wins:
• Increase flushwriters, if blocked: Flushing memTable to sstables, if we look in nodetool tpstats tool ,we will see flushwriters regularly getting blocked and we only have one flushwriters which is common on system which has only one disk, we can increase it to 2 that can resolve the problem.
• Decrease concurrent compactors: we see lot of people to set their concurrent compactors to high, we recommend at 2 watch for CPU saturation. And if saturated, we can drop it to 1 which will make compaction single thread that is by default.
• Increase concurrent reads and writes appropriately: Write is very affecting by CPU then read is very affecting by disk (the kind of disks, the number of disks available) so adjust concurrent reads and writes appropriately.
• Nudge Cassandra to leverage OS cache to read based workloads: nudge means more RAM so the more we can read in RAM, better will be the performance.
• In cloud environment, sometimes we need to increase phi_convict_threshold for cloud deployments or those with bad network connectivity.
• Increase compaction_throughput if disk I/O is available and compactions are falling behind: take the default for 15 MB/s, if we have lot of disk IO available, just increase this, then the compaction will complete quickly.
• Increase streaming_throughput to increase the pace of streaming:the default is 200MB/s when we bring the node online and the last repair but if we want to bring the node online faster, this is the parameter which we can increase.
• In terme of tuning data model: if we have a time series data modelling, we can learn a lot of by reading the link: http://planetcassandra.org/blog/getting-started-with-time-series-data-modeling/
• Avoid creating more than 500 tables in Cassandra: if it is empty, these tables take at least 1MB of space on heap.
• Keep wide rows under 100 MB or 100000 columns: we remember the in memory compaction by default has 15 MB, that the reason, it is a bad idea to have wide rows below 100 MB.
• Leverage wide rows instead of collections for high granularity items: sometimes, people have partition that contains lot of list, for that, it is recommended to use clustering column.
• Avoid data modelling hotspots by choosing a partition key that ensures read/write workload is spread across cluster: try to find the right partition key, not to large partition key not to small.
• Avoid tombstone build up by leveraging append only techniques.
You can read also these documents about tombstones:
http://thelastpickle.com/blog/2016/07/27/about-deletes-and-tombstones.html
http://www.jsravn.com/2015/05/13/cassandra-tombstones-collections.html
You can view this video about tombstones:
https://www.youtube.com/watch?v=olTsTxpBFqc&feature=youtu.be&t=270
• Use DESC sort to minimize impact of tombstones, if I do a descending sort by trying to get recent data.
You can read also this document:
http://www.sestevez.com/range-tombstones/
• Use inverted indexes to help where data duplication or nesting is not appropriate.
• Use DataStax drivers to ensure coordinator workload is spread evenly across cluster.
• Use the token Aware load balancing policy: allows you to go directly to the data of the data by avoiding to go to the coordinator.
• Use Prepared Statements (where appropriate), if you do a query a lot of time, you will see performance gain if you use that.
• Put OpsCenter’s database on a dedicated cluster.
• Size the cluster for peak anticipated workload: for example for load balancing or bench marking.
• Use a 10G network between nodes to avoid network bottlenecks.
• On JVM hand memery size, the number one is RAM and the CPU if we want Garbage Collection to run faster, so ensure there is adequate RAM to keep active data in memory.
• Understand how heap allocation affects performance.
• Look at how the key cache affects performance in memory.
• Understand bloom filters and their impact in memory: we can tune it on the table by the false positive bloom filter to eliminate unnecessary disk seek.
• Disable swap: swap can cause problem and it will be very very difficult to reproduce, we have to disable it by the command:
sudo swapoff –a
• Remove all swap files on /etc/fstab by:
sed -i 's/^\(.*swap\)/#\1/' /etc/fstab
• Look at the impact of memtables on performance: by default, memtables take records by heap then the more memtables we have, the more flushing them on the disk, then the more disk IO, so understanding, how many we have, how many they are flushing
What are some Cassandra/environment anti-patterns?
1. Network attached storage. Bottlenecks include: when you put Cassandra on the SAN, it like you are putting it on the top on storage system also Cassandra has sequential pattern of reads and writes. Advice is don’t use SAN plus it will be cheaper.
Use Cassandra on the SAN will increase network latency to all of operations.
• Router latency
• Network Interface Card (NIC)
• NIC in the NAS device
2. Shared network file systems.
3. Excessive heap space size: that can cause the JVM pause time very high because running it memory takes time.
• Can impair the JVM’s ability to perform fluid garbage collection.
4. Load balancers: don’t put load balancers between applications in Cassandra because Cassandra has the load balancer built into the drivers.
5. Queues and queue-like datasets: don’t use Cassandra like a queue.
• Deletes do not remove rows/columns immediately.
• Can cause overhead with RAM/disk because of tombstones.
• Can affect read performance if data not modelled well.


