
Alternatives to DataStax OpsCenter
After our latest upgrade of OpsCenter at the top of its UI new banner showed up with rather sad announcement:
Starting with version 6.0, OpsCenter will only be compatible with DataStax Enterprise (DSE) clusters. For more information, please see OpsCenter Policy Changes. Dismiss
As community edition of Cassandra works for us and we never felt a need to introduce DataStax Enterprise it was a time to start digging for alternatives.
I’ve begun with checking how we’re really using OpsCenter now because our main source of various metrics is Graphite as described in previous stories — Monitoring Cassandra and Monitoring Cassandra garbage collector.
I’ve found Graphite / Grafana much more useful for time series data. Charts are more readable and it offers options like shared crosshair or annotations with events about our releases or changes in configuration made by Puppet.
This all gives nice overview of the whole system and is a great help while doing postmortem.
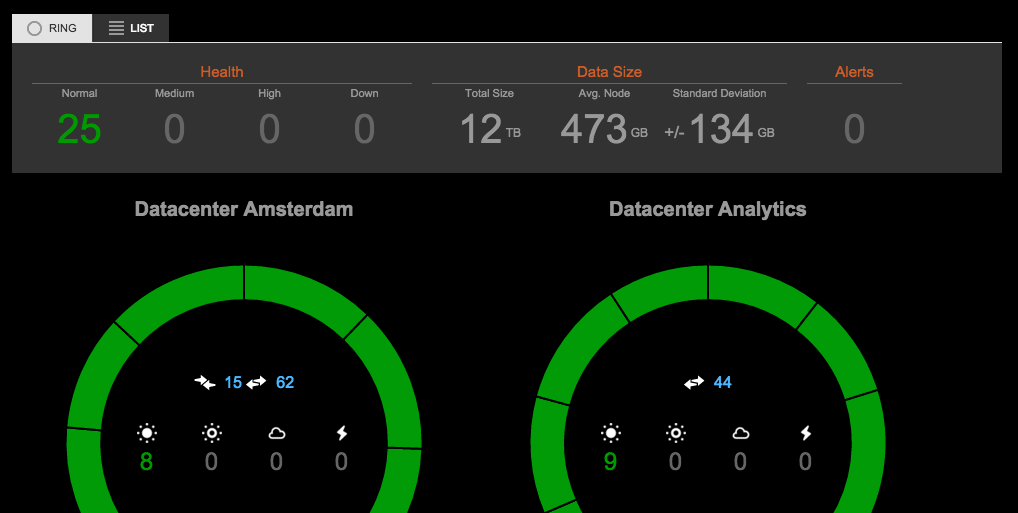
OpsCenter on the other hand is good mainly to see current state of the cluster — how it works right in this moment. The rings we see at the top are quite heavy used by me to immediately see nodes’ state while rolling upgrades or restarts to verify adjustments in cassandra.yaml. I instantly see if node is still joining, does many streaming operations or is overloaded (marked f.ex. with yellow colour).
You might say that the same can be achieved with grepping through system.log or using some nodetool commands but typing the same instructions over and over again becomes tedious really quickly.
So the goal was to find a solution which shows the current state of C* cluster.
What others are using?
Couple of months ago on Cassandra mailing list there was a survey about how C* is used and one of the questions was about monitoring tools. Results are available online here.
212 answers recorded regarding monitoring systems. The most popular ones are (with more than 3% votes):
- DataStax OpsCenter 85 (40%)
- Nagios 43 (20%)
- Graphite 15 (7%)
- In-house tools 11 (5%)
There is no clear candidate on this list to replace the winner. Nagios is very simple (too simple) to use for more things than just checking if process is running and binary or gossip protocols are enabled. By Graphite I can imagine that it’s directly fed by custom reporter or by some aggregating proxy like StatsD which gets input from tools like Diamond.
So there is no popular solution to display current state of the cluster with nice UI. Probably bigger teams / companies rely on some proprietary solutions tight to existing monitoring infrastructure or something tailored to their needs.
Digging through the Web
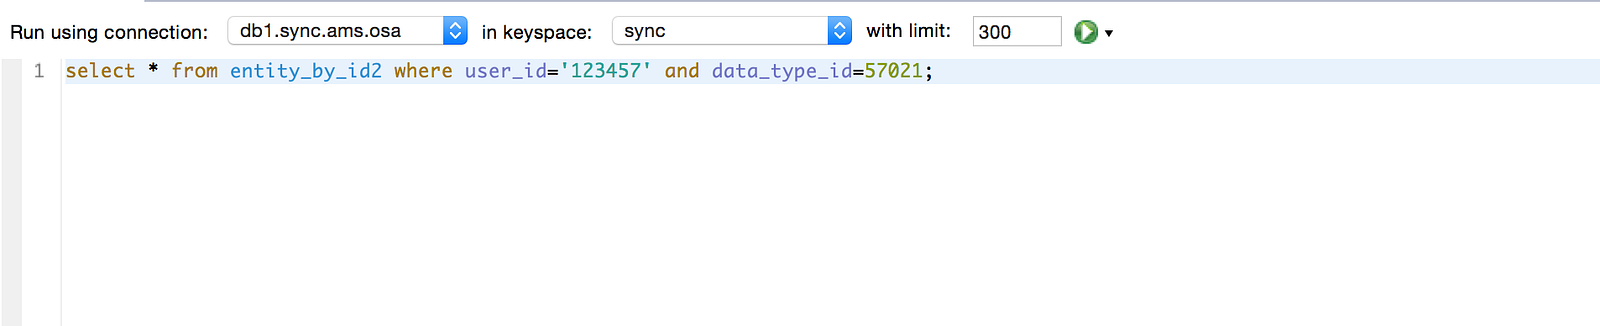
I’ve found couple of abandoned projects in this area like Cassandra Cluster Admin, Virgil, Cassandra GUI or Helenos and it was really easy to immediately say “No!” when it goes to even start thing about trying it out. Most of aforementioned tools also duplicates functionality of DataStax DevCenter which is mainly about executing CQL queries.
One option which looked promising was Priam — actively developed and used by Netflix which could guarantee that it’ll be maintained (at least as soon as will be used there internally). Unfortunately it’s tight to S3 as a backend which isn’t used by us. We could of course try to push some changes upstream but the list of offered features finally wasn’t that interesting regarding our goal to have system which nicely show current state of the cluster.
Enhancing current stack
Other option was to adjust our current stack (Diamond / StatsD / Graphite / Grafana) to get more information about state of the cluster.
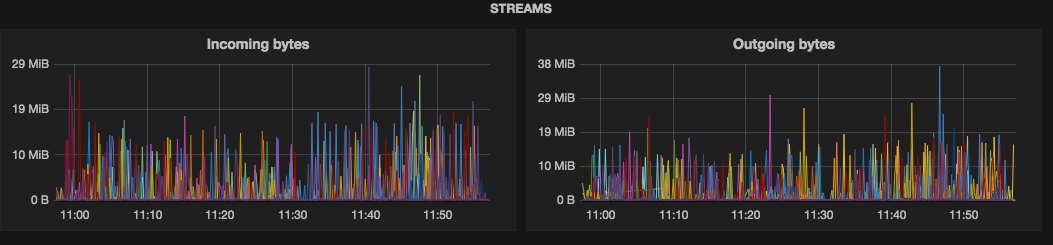
OpsCenter displays nice overview of streaming operations. It’s immediately visible how many streams are active, their progress and nodes on both ends. Let’s see if C* exposes metrics we can use to mimic this behaviour:
org.apache.cassandra.metrics:type=Streaming,name=TotalIncomingBytes
org.apache.cassandra.metrics:type=Streaming,name=TotalOutgoingBytes
are useful as will show how active streaming is over time. There is also:
org.apache.cassandra.metrics:type=Streaming,name=ActiveOutboundStreams
but unfortunately always gives 0 (filed CASSANDRA-11174).
org.apache.cassandra.net:type=StreamManager
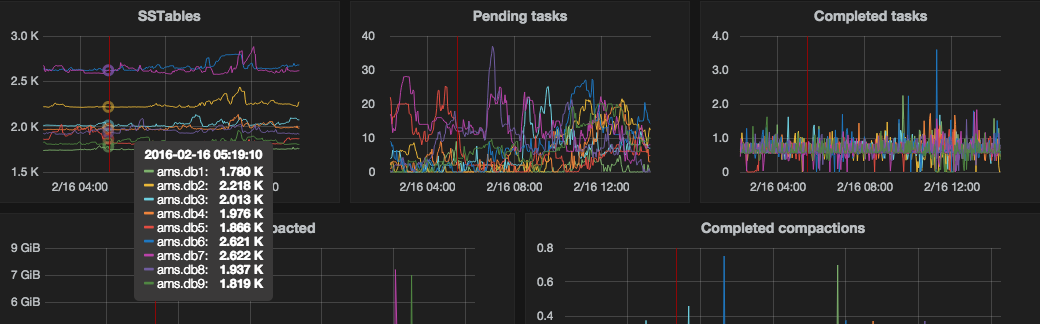
looks promising with lots of useful data inside but it has more complex structure and its use requires more work. Finally I ended up with very simple charts for now:
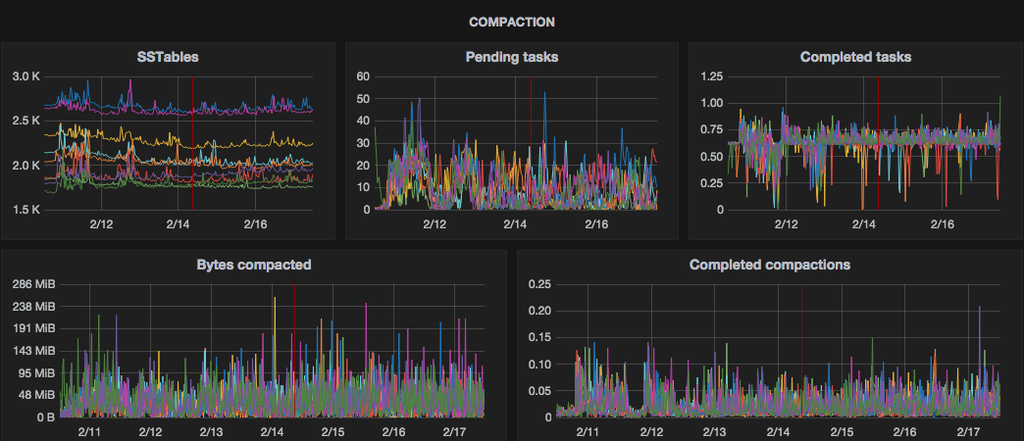
When it goes to compaction we’ve solid charts in Grafana already so OpsCenter isn’t useful with this part:
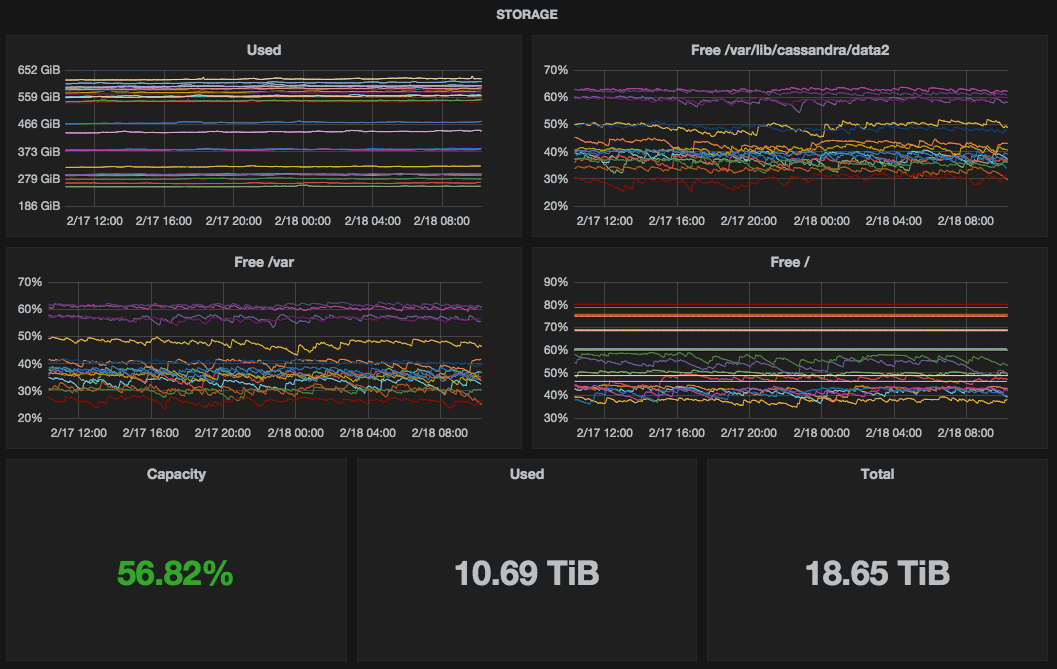
The last element which was used by use is view of cluster’s storage. It was easy to move it into Grafana and use single stat charts:
To mimic behaviour of mentioned rings which show status of each node (if it’s joining, active etc.) I’ve found:
org.apache.cassandra.db:type=StorageService
This MBean contains all what is needed but currently f.ex. Diamond and its collector for Cassandra doesn’t allow to retrieve it easily.
In finding replacement for OpsCenter I’ve ended up extending our current stack with more metrics and charts. I couldn’t use it though to display detailed information about streaming and current status of nodes. Fortunately there are MBeans storing such info so there is a chance we’ll try to use it in the future. Will see how extended charts in Grafana will serve as a potential replacement. I guess when more people / teams will have the issue with loosing support for OpsCenter there will be some initiatives to tackle this problem.