OpsCenter
And Search for its Replacement
Table of Contents
- Abstract
- Need of Open Tools
- Tasks of OpsCenter
- Features of OpsCenter
- Enterprise Edition
- Conclusion
Abstract
DataStax OpsCenter is a visual management and monitoring solution for Apache Cassandra and DataStax Enterprise.
OpsCenter is one of the most important feature in DataStax community. When it comes to monitoring Cassandra clusters, OpsCenter is the favourite among DataStax customers.
OpsCenter version 5.2.4 monitor, manage and maintain the
- OSS Cassandra [ Open Source Software Cassandra clusters ]
- DDC [ DataStax Distributions of Cassandra Clusters ]
- Or DSC [ DataStax Community ].
But due to the policy changes, starting of OpsCenter version 6.0, OpsCenter will only be compatible with DSE clusters [ DataStax Enterprise clusters ]. DataStax will discontinue their support with OSS, DDC clusters.
This brings to the point , where either the customers has to upgrade their clusters to Enterprise Edition or they need to find a replacement for OpsCenter tool.
Community Edition of Cassandra Vs DSE [ Enterprise Edition ]
|
Feature |
Open Source |
DataStax Enterprise |
|
Core Security Features |
* |
* |
|
Enterprise Security Features |
No |
* |
|
Built in automatic management services |
No |
* |
|
Integrated enterprise search |
No |
* |
|
Integrated streaming, real-time, batch analytics |
No |
* |
|
External Hadoop Integratoin |
No |
* |
|
In-Memory Feature |
No |
* |
|
Worklaod management/isolation |
No |
* |
|
Easy Migration of RDBMS and log data |
No |
* |
|
Certified software Updates |
No |
* |
|
Certified platform support |
No |
* |
|
OpsCenter |
Basic Funcitonality |
Advanced Functionality |
Replacement for OpsCenter
Starting with version 6.0, OpsCenter will only be compatible with DataStax Enterprise (DSE) clusters. Since only the Basic functionality will be available, the earlier versions will be available without the Advanced functionalities such as,
Certified Software Updates and Certified Platform Supports.
So, when started searching for alternatives, few Open tools came very close to the functionalities of Earlier releases of OpsCenter. Tools such as,
- Nagios
- Graphite
- Grafana
Grafana
Grafana is an open source metrics dashboard and graph composer for Graphite and InfluxDB
Latest Version: Grafana v3.0
Updates in Latest Version:
- Refactored Data Source plugin architecture and added 2 new plugin types:
- Panel plugins: to add new panel types for Dashboards.
- App plugins: Bunles Panels plugins, Data Sources plugins, Dashboards and Grafana Pages.
- Grafana-cli: Grafana 3.0 comes with a new command line tool called grafana-cli. It easily install plugins from Grafana.net
“ grafana–cli install grafana–pie–chart–panel “Graphite Support:
Grafana includes a built in Graphite query parser that takes writing graphite metric expressions to a whole new level. Expressions are easier to read and faster to edit than ever.
- Click on any metric segment to change it
- Quickly add functions ( search )
- Click on a function parameter to change it.
- Rich templating support.
InFluxDB Support:
- Rich editor with measurement, tag and tag value completion
- Automatic handling of group by time
- Templating queries for generic dashboards.
Features of Grafana:
Rich Graphing:
- Fast and Flexible client side graphs with a multitude of options, with Bars, Lines, Points, & Thresholds, Logarithmic scales and View or edit graph in fullscreen.
Graph Styling:
- Full control for how each series should be drawn. Mix stacked series with isolated series. & Export any graph to png image.
Annotations:Annotate graphs with rich events from different data sources. Hover over events shows you the full event metadata and tags.
- Fetch annotations from Elasticsearch.
- Fetch annotations from GRAPHITE Events and Metrics.
- Fetch annotations from InFluxDB
Many data sources & plugins:All data sources in Grafana are using the same data source plugin API.
- Mix different data sources on the same dashboard.
- Mix different data sources in the same graph.
- Add custom data sources.
The below picture describes the measurement graph, done for Read, Write operations during Benchmarking Test performed on a 3 node cluster.
Nagios
Nagios is a powerful monitoring system that enables organizations to identify and resolve IT infrastructure problems before they affect critical business processes. In the event of a failure, Nagios can alert technical staff of the problem, allowing them to begin remediation processes before outages affect business processes, end-users, or customers.
Cassandra Monitoring plugins
Nagios monitors Cassandra in two ways, Check Cassandra Cluster & Check Cassandra Status and Heap Memory.
- 1. Check Cassandra Cluster
The Cluster Node Check Plugin is designed to verify whether the number of live nodes is less than a specified number, and if so, trigger a warning or critical alert within Nagios XI. This plugin needs to run on a server with the Apache Cassandra nodetool utility.
- 2. Memory Heap and Other Metrics Retrievable Through JMX:
- Montiors Cassandra status and Heap Memory Utilization
The Memory Heap and Status plugin script (written in perl) from the Nagios Exchange can be used to monitor Cassandra status and heap utilization (cassandra.pl). Need to use NRPE or another agent of your choice to use this check and install it on Cassandra Servers, as it relies on Cassandras “nodetool” utility
OpsCenter Vs Other Open Tools
OpsCenter
Tasks of OpsCenter:
- Adding and expanding clusters
- Configuring nodes
- Viewing performance metrics
- Rectifying issues
- Monitoring the health of your clusters on the dashboard
Features of OpsCenter:
Dashboard:
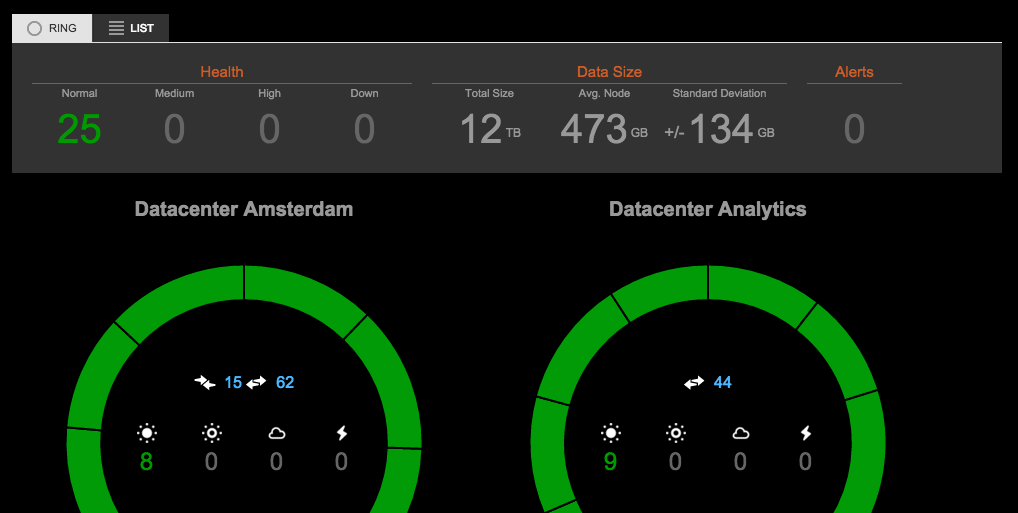
A single point of communication or a centralized dashboard that allows a, at a glance management.
A sample image of a Datastax OpsCenter,
Configuration and Administration:
Provides an “ User Friendly Environment “ with a visual support for creating new clusters, adding or removing clusters from existing clusters.
- Administration tasks, such as adding a cluster, using simple point-and-click actions.
- Multiple cluster management from a single OpsCenter instance using agents.
- Multiple node management.
- Downloadable PDF cluster report.
Fault Tolerence:
Automatic failover is built into OpsCenter, which helps ensure that any scheduled tasks or monitoring activities continue even if a primary OpsCenter service fails.
Provactive Assistance:
Proactive help is available in OpsCenter for troubleshooting problems and planning for future needs. Forecasting future capacity needs (e.g. when will I need more disk space or RAM?) is carried out with a single mouse click.
Enterprise Only Functionality
- Enterprise functionality in OpsCenter is only enabled on DataStax Enterprise clusters.
- Monitoring capabilities of DSE In-Memory tables.
- View the Spark console.
- Automatic failover from the primary OpsCenter to a backup OpsCenter instance.
- Security, with the ability to define user roles.
DSE Management Services:
Repair Service:
The Repair Service is configured to run continuously and perform repair operations across a DSE cluster in a minimally impactful way.
Capacity Service:
Using trend analysis and forecasting, the Capacity Service helps users understand how their cluster is performing within its current environment and workload, and gain a better sense of how time affects those trends, both past and future.
Data Backup and Restore:
A backup is a snapshot of all on-disk data files (SSTable files) stored in the data directory. Backups are taken per keyspace and while the system is online. A backup first flushes all in-memory writes to disk, then makes a hard link of the SSTable files for each keyspace. Backups are stored in the snapshots directory of the column family that’s being snapshotted. For example,/var/lib/cassandra/data/OpsCenter/settings/snapshots.
. OpsCenter Data Backups allows you to specify a schedule to remove old backups and prevent backups from being taken when disk space falls below a specified level.
Alerts:
|
Metric |
Definition |
|
Node down |
When a node is not responding to requests, it is marked as down. |
|
Write requests |
The number of write requests per second. Monitoring the number of writes over a given time period can give you and idea of system write workload and usage patterns. |
|
Write request latency |
The response time (in milliseconds) for successful write operations. The time period starts when a node receives a client write request, and ends when the node responds back to the client. |
|
Read requests |
The number of read requests per second. Monitoring the number of reads over a given time period can give you and idea of system read workload and usage patterns. |
|
Read request latency |
The response time (in milliseconds) for successful read operations. The time period starts when a node receives a client read request, and ends when the node responds back to the client. |
|
CPU usage |
The percentage of time that the CPU was busy, which is calculated by subtracting the percentage of time the CPU was idle from 100 percent. |
What others are using?
On Cassandra mailing list there was a survey about how C* is used and one of the questions was about monitoring tools.
212 answers recorded regarding monitoring systems. The most popular ones are (with more than 3% votes):
- 1. DataStax OpsCenter 85 (40%)
- 2. Nagios 43 (20%)
- 3. Grafana 15 (7%)
- 4. In-house tools 11 (5%)
Conclusion
As per the survey and simple to use, Grafana & Nagios are the tools, which comes very close in the solution for “ The Search for OpsCenter’s Replacement “.
Will be bringing up more technical details on ” Grafana + InfluxDB ” in Bench marking test on a Cassandra cluster in the next blog.
Thank You.


