Elassandra simplifies your data stack by combining the power of Elasticsearch and Apache Cassandra into a single unique solution.
Elasticsearch is by design a sharded master-slave architecture.
The Elasticsearch master node manages the mapping changes and only the primary shards takes write operations. The replica shards are read-only and can be promoted to primary shards by the master node in case of failure or maintenance. By relying on Apache Cassandra, Elassandra is master-less and has no Single Point Of Write. All nodes can process the search requests, request a mapping update, and depending on the Cassandra replication factor, take write operations.
As a result, Elassandra is pretty simple to manage with Kubernetes and maintenance operations (rolling restart for upgrade) can be done without any downtimes. Scaling up or down also becomes a lot more simple, no need to re-index the existing Elasticsearch indices, only the moved data is re-indexed in Elasticsearch. Elassandra also natively supports cross datacenter replication.
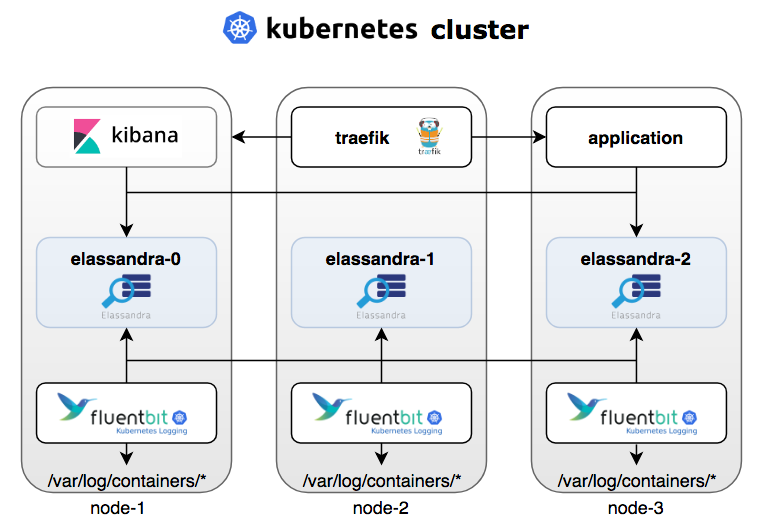
To show the ability of Elassandra to work properly on Kubernetes, we have used Fluent-Bit, a fast and lightweight log processor and forwarder that support the Elasticsearch backend, but the same configuration could also use Fluentd or Filebeat.
To deploy our EFK stack on Kubernetes, we have used the HELM charts as follow. First one needs to deploy an Elassandra with a 3 nodes cluster with SSD storage (here on Azure Kubernetes Service) from the Strapdata HELM repository.
helm install --name "elassandra" --namespace default \
--set image.repo=strapdata/elassandra \
--set image.tag=6.2.3.10 \
--set config.cluster_size=3 \
--set persistence.storageClass=managed-premium \
strapdata/elassandra
Elassandra exposes an Elasticsearch and an Apache Cassandra service. Then, one needs to deploy Kibana with the same Elasticsearch version as the one embedded in Elassandra:
helm install --namespace default --name my-kibana  \
--set image.tag=6.2.3 \
--set service.externalPort=5601 \
stable/kibana
Alternatively, you can deploy Traefik, a Kubernetes ingress proxy allowing to expose Kibana on a public IP:
helm install --name traefik --namespace kube-system --set dashboard.domain=traefik-dashboard.aks1.strapdata.com stable/traefikhelm install --namespace $NAMESAPCE --name my-kibana
--set image.tag=6.2.3 \
--set service.externalPort=5601 \
--set env.ELASTICSEARCH_URL="http://elassandra-elasticsearch:9200" \
--set ingress.enabled=true,ingress.hosts[0]="kibana.${1:-aks1.strapdata.com}",ingress.annotations."kubernetes\.io/ingress\.class"="traefik" \
stable/kibana
Third, you need to deploy fluent-bit with a specific Elasticsearch index template. This template includes the Elassandra specific settings to optimise the storage and search performances.
helm install --name my-fluentbit --set trackOffsets="true" \
--set backend.type="es",backend.es.host="elassandra-elasticsearch.default.svc.cluster.local",backend.es.time_key="es_time",backend.es.pipeline="fluentbit" \
--set parsers.enabled=true,parsers.json[0].name="docker",parsers.json[0].timeKey="time",parsers.json[0].timeFormat="%Y-%m-%dT%H:%M:%S.%L",parsers.json[0].timeKeep="Off"
strapdata/fluent-bit
Once deployed on Kubernetes nodes, fluent-bit starts to send pod’s logs to our Elassandra cluster.
Our Fluent-bit HELM chart basically provides an Elasticsearch index template optimised for Elassandra with the following index template settings:
"settings": {
"index": {
"replication": "DC1:2",
"table_options": "compaction = {'compaction_window_size': '4', 'compaction_window_unit': 'HOURS', 'class': 'org.apache.cassandra.db.compaction.TimeWindowCompactionStrategy'}",
"mapping": {
"total_fields": {
"limit": "10000"
}
},
"refresh_interval": "15s",
"drop_on_delete_index": "true",
"index_insert_only": "true",
"search_strategy_class": "RandomSearchStrategy"
}
Insert only mode
In Elassandra, Elasticsearch _source document are stored in a Cassandra table as rows. When inserting into Elassandra via the the Elasticsearch index API, empty fields are populated with null by default in the Cassandra storage layer in order to overwrite any existing documents. It generates some Cassandra tombstones, but when inserting some immutable log records, it is useless, and in this case, the index.index_insert_only settings optimise the Cassandra storage.
Drop on delete index
In Elassandra, Cassandra is basically the data storage layer and by default, removing an index does not remove the underlying Cassandra table and keyspace. You can alter it with the index.drop_on_delete_index setting, removing the last index on a table will remove the underlying Cassandra table. Thus, purging Elasticsearch indices will also drop underlying keyspaces automatically.
Replication
In Elassandra, data replication is no longer done by Elasticsearch but by Cassandra itself. Then, the underlying keyspace replication map controls the location (in which Cassandra datacenters) and the number of copies. The replication setting in the Elasticsearch template defines the Cassandra replication map, here on DC1 with 2 copies.
Table options
The table_options settings define the Cassandra table options used at creation time. Here, as the log records are immutable, we have chosen the Time Window Compaction Strategy designed for the time series data. You could also set here the Cassandra default TTL or the compression settings (LZ4 by default).
Search strategy
In Elassandra, the coordinator node distributes the sub-queries to the available nodes according the search strategy defined by a search_strategy_class. By default, the PrimaryFirstSearchStrategy sends a sub-query to all nodes in the Cassandra datacenter. Here, we use the RandomSearchStrategy that computes the smallest set of nodes required to get a consistent result in the datacenter. For example, with a replication factor of 2 in a 6 nodes cluster, this strategy will only request 3 nodes, reducing the global load of the clusters.
Because the Elasticsearch fields are multi-valued, Elassandra stores each field of type X in a Cassandra list. If you look at the generated SSTables with the sstabledump utility, you will be able to find Cassandra rows generated by fluent-bit:
{
"partition" : {
"key" : [ "RL5Bp2cBWzCxo-DQnARL" ],
"position" : 160123
},
"rows" : [
{
"type" : "row",
"position" : 160691,
"liveness_info" : { "tstamp" : "2018-12-13T11:09:14.378005Z" },
"cells" : [
{ "name" : "es_time", "deletion_info" : { "marked_deleted" : "2018-12-13T11:09:14.378004Z", "local_delete_time" : "2018-12-13T11:09:14Z" } },
{ "name" : "es_time", "path" : [ "868796ae-fec7-11e8-aa29-7b1a7ab32955" ], "value" : "2018-12-13 11:08:42.265Z" },
{ "name" : "kubernetes", "deletion_info" : { "marked_deleted" : "2018-12-13T11:09:14.378004Z", "local_delete_time" : "2018-12-13T11:09:14Z" } },
{ "name" : "kubernetes", "path" : [ "868796aa-fec7-11e8-aa29-7b1a7ab32955" ], "value" : {"container_name": ["logs-generator"], "host": ["aks-nodepool1-36080323-0"], "annotations": null, "docker_id": ["e38071228edf79584ef4eafdfb67c0144605a31730e71b02b3f6e1c8f27e0ea3"], "pod_id": ["721a6540-fca4-11e8-8d8b-f6dcc5e73f85"], "pod_name": ["logs-generator"], "namespace_name": ["default"], "labels": [{"app": null, "controller-revision-hash": null, "release": null, "pod-template-generation": null, "statefulset_kubernetes_io/pod-name": null, "kubernetes_io/cluster-service": null, "k8s-app": null, "name": null}]} },
{ "name" : "log", "deletion_info" : { "marked_deleted" : "2018-12-13T11:09:14.378004Z", "local_delete_time" : "2018-12-13T11:09:14Z" } },
{ "name" : "log", "path" : [ "868796ab-fec7-11e8-aa29-7b1a7ab32955" ], "value" : "I1213 11:08:42.265287       6 logs_generator.go:67] 362287 PUT /api/v1/namespaces/ns/pods/s2qj 215\n" },
{ "name" : "stream", "deletion_info" : { "marked_deleted" : "2018-12-13T11:09:14.378004Z", "local_delete_time" : "2018-12-13T11:09:14Z" } },
{ "name" : "stream", "path" : [ "868796ac-fec7-11e8-aa29-7b1a7ab32955" ], "value" : "stderr" },
{ "name" : "time", "deletion_info" : { "marked_deleted" : "2018-12-13T11:09:14.378004Z", "local_delete_time" : "2018-12-13T11:09:14Z" } },
{ "name" : "time", "path" : [ "868796ad-fec7-11e8-aa29-7b1a7ab32955" ], "value" : "2018-12-13 11:08:42.265Z" }
]
}
]
}
As you can see, due to the Cassandra collections (list, set and map), useless overheads are created. Elassandra extends the Elasticsearch mapping with new attributes, and the “cql_collection”:”singleton” attribute allows to explicitly map the single-valued fields to the corresponding Cassandra type. By adding this, to the single-valued fields in our fluent-bit index template, the Cassandra rows becomes lighter as shown bellow:
root@elassandra-0:/usr/share/cassandra# tools/bin/sstabledump /var/lib/cassandra/data/logstash_2018_12_17/flb_type-751e28a0022f11e9a83bbd84c8d6464a/mc-9-big-Data.db....
{
"partition" : {
"key" : [ "nmWfvWcBHsJPeHipoGsM" ],
"position" : 402735
},
"rows" : [
{
"type" : "row",
"position" : 403179,
"liveness_info" : { "tstamp" : "2018-12-17T19:23:34.412Z" },
"cells" : [
{ "name" : "es_time", "value" : "2018-12-17 19:23:33.603Z" },
{ "name" : "kubernetes", "value" : {"container_name": "logs-generator", "host": "aks-nodepool1-36080323-0", "docker_id": "e33b2cda2ed7ac3bc5a6504cd79b6ea999137a11791d67fbb8b497fe06d8d700", "pod_id": "8ecacdcd-0229-11e9-8d8b-f6dcc5e73f85", "pod_name": "logs-generator", "namespace_name": "default", "labels": [{"app": null, "component": null, "controller-revision-hash": null, "tier": null, "pod-template-generation": null, "name": null, "pod-template-hash": null, "version": null, "k8s-app": null, "kubernetes_io/cluster-service": null, "release": null, "statefulset_kubernetes_io/pod-name": null, "run": ["logs-generator"]}], "annotations": null} },
{ "name" : "log", "value" : "I1217 19:23:33.600235       6 logs_generator.go:67] 2850 POST /api/v1/namespaces/ns/pods/65w 207\n" },
{ "name" : "stream", "value" : "stderr" },
{ "name" : "time", "value" : "2018-12-17 19:23:33.603Z" }
]
}
]
}
As a result, the Cassandra storage for logs is optimized and becomes a lot more efficient than storing the JSON _source document in a Lucene stored field.
For each log records, Fluentbit adds some Kubernetes metadata, and for a docker container, these metadata are always the same. With the Cassandra wide row storage, we can store these metadata only once and for many log records, thus reducing the disk size of SSTables. The following figure illustrates the Cassandra storage of Elasticsearch documents:
To achieve this, an Elasticsearch pipeline transforms the original JSON documents to add a new unique timestamp stored as a timeuuid (a Type 1 UUID), and build a document _id in the form of a Cassandra compound key with the docker container id as the partition key, and the new timeuuid as a clustering key.
curl -H "Content-Type: application/json" -XPUT
"http://elassandra-0:9200/_ingest/pipeline/fluentbit" -d'
{
"description" : "fluentbit elassandra pipeline",
"processors" : [
{
"timeuuid" : {
"field": "es_time",
"target_field": "ts",
"formats" : ["ISO8601"],
"timezone" : "Europe/Amsterdam"
}
},
{
"set" : {
"field": "_id",
"value": "[\"{{kubernetes.docker_id}}\",\"{{ts}}\"]"
}
}
]
}'
Then, we can add the following mapping attributes to our Fluent-bit Elasticsearch template:
- On the partition key column, cql_partition_key: true and cql_primary_key_order:0
- On the clustering key column, cql_primary_key_order:1 and cql_type:timeuuid
- On the Kubernetes metadata column, cql_static_column: true
curl -H "Content-Type: application/json" -XPUT "http://elassandra-0:9200/_template/template_fluentbit" -d@fluentbit_template.json
After cleaning the existing index and redeploying the new Elasticsearch pipeline and template, the SSTables contains one wide row per container and per day. The log storage is now optimal and Kubernetes metadata is only stored once per day for each docker container. Even timestamp fields (es_time and time) can be removed because some time is freed up for the Cassandra clustering key, a timeuuid column seen as a date by Elasticsearch.
{
"partition" : {
"key" : [ "f9f237c2d64dd8b92130fd34f567b162f0ae1972e7afabee9151539ba31ccadd" ],
"position" : 2800
},
"rows" : [
{
"type" : "static_block",
"position" : 3326,
"cells" : [
{ "name" : "kubernetes", "value" : {"container_name": "put-template", "host": "aks-nodepool1-36080323-0",
"pod_id": "e24f2521-1256-11e9-8fe6-de1ce27ac649",
"pod_name": "fluent-bit-sc6m6", "namespace_name": "default",
"labels": [{"app": "my-fluentbit-fluent-bit", "component": null, "controller-revision-hash": "3156758786", "tier": null,
"pod-template-generation": "1", "name": null, "pod-template-hash": null, "version": null, "k8s-app": null, "kubernetes_io/cluster-service": null,
"release": ["my-fluentbit"], "statefulset_kubernetes_io/pod-name": null}],
"annotations": [{"checksum/config": ["3375211361605629fc5a1f970e1fce0ce2fabbcb08ef4631acdc4bd2ac41fd7b"],
"scheduler_alpha_kubernetes_io/critical-pod": null, "prometheus_io/port": null, "prometheus_io/scrape": null}]},
"tstamp" : "2019-01-07T08:33:35.968Z" }
]
},
{
"type" : "row",
"position" : 3326,
"clustering" : [ "e4375630-1256-11e9-a990-c3ec4d724241" ],
"liveness_info" : { "tstamp" : "2019-01-07T08:33:35.954Z" },
"cells" : [
{ "name" : "log", "value" : "  % Total    % Received % Xferd  Average Speed   Time    Time     Time  Current\n" },
{ "name" : "stream", "value" : "stderr" }
]
},
{
"type" : "row",
"position" : 3326,
"clustering" : [ "e4375630-1256-11e9-0566-b0312df0dcfc" ],
"liveness_info" : { "tstamp" : "2019-01-07T08:33:35.964Z" },
"cells" : [
{ "name" : "log", "value" : "                                 Dload  Upload   Total   Spent    Left  Speed\n" },
{ "name" : "stream", "value" : "stderr" }
]
}
You can then use Kibana as usual to explore your logs and create dashboards.
In order to check the availability of Elassandra, we have ingested some logs with a log generator.
for i in {1..20}; do kubectl run logs-generator${i} --generator=run-pod/v1 --image=k8s.gcr.io/logs-generator:v0.1.1 \
--restart=Never --env "LOGS_GENERATOR_LINES_TOTAL=50000" --env "LOGS_GENERATOR_DURATION=3m"; done
Then, we have killed an Elassandra POD, causing the node to be restarted by the Kubernetes controller.
$kubectl delete pod/elassandra-1 pod “elassandra-1” deleted
With a Cassandra replication factor of 1, loosing one Elassandra node causes write errors as expected:
[2019/01/10 16:46:09] [ warn] [out_es] Elasticsearch error
{"took":3,"ingest_took":2,"errors":true,"items":[{"index":{"_index":"logstash-2019.01.10","_type":"flb_type","_id":"[\"c0e45980637031ed19386d8a2b3fa736597057eea46917b8c28b73ba640e3cc3\",\"25c13480-14f6-11e9-2b53-a734ca6c6447\"]","status":500,"error":{"type":"write_failure_exception","reason":"Operation failed - received 0 responses and 1 failures"}}},{"index":{"_index":"logstash-2019.01.10","_type":"flb_type","_id":"[\"c0e45980637031ed19386d8a2b3fa736597057eea46917b8c28b73ba640e3cc3\",\"372b3680-14f6-11e9-d3d8-e1397bcf3034\"]","status":500,"error":{"type":"write_failure_exception","reason":"Operation failed - received 0 responses and 1 failures"}}},{"index":{"_index":"logstash-2019.01.10","_type":"flb_type","_id":"[\"c0e45980637031ed19386d8a2b3fa736597057eea46917b8c28b73ba640e3cc3\",\"41a8c280-14f6-11e9-bc51-b90088b4aa65\"]","status":500,"error":{"type":"write_failure_exception","reason":"Operation failed - received 0 responses and 1 failur
Then we setup a Cassandra replication factor of two for the Logstash index:
kubectl exec -it elassandra-0 -- cqlsh
Connected to elassandra at 127.0.0.1:9042.
[cqlsh 5.0.1 | Cassandra 3.11.3.5 | CQL spec 3.4.4 | Native protocol v4]
Use HELP for help.
cqlsh> ALTER KEYSPACE logstash_2019_01_10  WITH replication = {'class': 'NetworkTopologyStrategy','DC1':'2'};
During the same test, Fluentbit indicated some broken connection errors, but managed and succeeded to write to Elassandra.
[2019/01/10 16:57:39] [error] [http_client] broken connection to elassandra-elasticsearch.default.svc.cluster.local:9200 ?
[2019/01/10 16:57:39] [ warn] [out_es] http_do=-1
[2019/01/10 16:57:39] [error] [http_client] broken connection to elassandra-elasticsearch.default.svc.cluster.local:9200 ?
[2019/01/10 16:57:39] [ warn] [out_es] http_do=-1
Thanks to the Cassandra multi-master architecture, write operations were made possible on at least one node while one was restarting, event through the Elasticsearch API ! While a node was missing, the Elasticsearch indices became yellow, indicating there was a missing node, but the search was still consistent.
health status index               uuid                   pri rep docs.count docs.deleted store.size pri.store.size
yellow open   logstash-2019.01.10 p01ngidBRDSVsi99NupG5g   3   1     227478            0     88.3mb         88.3mb
yellow open   .kibana             68N_Dsk0SoOG9jHElafDUw   3   1          3            0     15.8kb         15.8kb
After the node restarted, the Elasticsearch indices switched back to green and the Cassandra nodes 0 and 2 sent hint handoff to node 1 to recover from the missed log records.
Elassandra presents an efficient new opportunity with Kuberntes for many user-cases. As demonstrated, with the right configuration, you can use the Elasticsearch pipeline processors to change and optimise the Cassandra storage, even if you don’t index at all in Elasticsearch (just say index=no in your Elasticsearch mapping, and you will only get the data in the underlying Cassandra table). And furthermore, you can maintain your Elassandra clusters with no downtime when rolling upgrades or easily scale up/down Elassandra (no need to re-index all).
Finally, Elassandra will support the cross-kuberentes-cluster replication in the multi-cloud environments, but that’s another story!