Illustration Image

Cassandra.Link

The best knowledge base on Apache Cassandra®

Helping platform leaders, architects, engineers, and operators build scalable real time data platforms.

2/3/2018

Reading time:5 min

Cassandra metrics and their use in Grafana

by Michał Łowicki

Cassandra metrics and their use in GrafanaDuring our adventure of adopting Cassandra for sync feature we’ve been hit by many things. Most of the time it was because we weren’t proficient with C* yet and equipped with detailed knowledge and experience in many areas related to it. Sometimes it also happened because of some nasty bugs either in our infrastructure or inside database itself.We would safe lots of energy and frustrating days at work having solid monitoring from the very beginning, allowing us to detect anomalies very early. Far too often we’re discovering metrics skyrocketing by running nodetool command during the work on usual tasks and not having proper charts with historic data. We’ve learned over time what to monitor and visualise so hopefully solution presented below will save lots of coffee and stress to anyone who’s seriously starting his journey with Cassandra. Many of changes we made to our monitoring infrastructure were dictated by incidents we had so this text is also a collection of our war stories. You can read about our infrastructure in previous posts:StatsD-centered monitoring setupMonitoring CassandraMonitoring Cassandra garbage collectorHere I’ll focus on final output — charts in Grafana which is used extensively by us and is fed by couple of collecting tools of our choice. Till the end of this post I’ll omit prefix “sync.$environment.$datacenter.$host.” of each metric for readability.At the moment we’ve two major dashboards. First one called “Sync database -general” contains generic things not strictly related to Cassandra itself but required to spot anomalies related to slow disk I/O, network issues or CPU.Data are gathered mainly by Diamond.CPU[embedded content]Metrics are provided by LoadAverageCollector. On several occasions we get some old hanging processes so number of total and running processes could be useful.MemoryThere were many memory leaks in 2.1.x branch (f.ex. CASSANDRA-9549 or CASSANDRA-9681) so this one helps out to detect them:gauges.memory.MemAvailableIt’s important to not use MemFree here which is something very different .NetworkWe’ve there f.ex:[embedded content]and similar for transferred data (tx_byte, tx_errors, …) handy to debug things together with NetOps team.DisksThis is quite large group (row) but really helpful in making sure our SSD disks are behaving well and aren’t saturated. It contains metrics like:[embedded content]provided by Diamond’s DiskUsageCollector.StatsDTo immediately see if everything is fine with StatsD daemon, number of metrics seems reasonable and that process is handling them in rational time we’re using two simple metrics sent automatically:statsd.numStatsstatsd.processing_timeUseful to verify that everything works fine after upgrade.The second dashboard “Sync — Cassandra” is purely about Cassandra and it was built over time while learning about new places worth to monitor or when we had suspicion that particular component isn’t working as it should.CompactionThis one is about SSTables and compaction process. It’s important to know early if compaction stuck on certain node(s), number of pending tasks is growing or SSTables count exploded. We had such incidents in the past and detecting it early or even discovering it at all saved us headaches and allowed to react quickly.[embedded content]Compacting large partitionsC* logs warnings while compacting partition longer than compaction_large_partition_warning_threshold_mb (cassandra.yaml). We’re using Logstash to parse these warnings and put into StatsD. Lots of such events with high numbers may indicate problems with schema.Two charts at the bottom are specific to our project where we’ve a concept of data type used a part of composite partition key.DiskCassandra provides also data about read / write latency:[embedded content]“Scanned tombstones” is fed by parsing C* logs and getting warnings about scanning large number of tombstones.Requests[embedded content]Errors[embedded content]These two accumulative metrics (use perSecond to get number of occurrences per second) show if either C* throws many exceptions and would be good to grep through its system.log or it can’t connect to other nodes which might be a sign of overloaded node(s) or network issues.Thread poolsThis might seem overwhelming but shows what threads are doing like creating Merkle trees (ValidationExecutor), compacting (CompactionExecutor) or just handling read requests.[embedded content]Key cacheWe don’t have hot data in Sync so row cache is disabled (row_cache_size_in_mb set to 0 in cassandra.yaml) but having charts for key cache to monitor its performance is precaution to save our time in the future.[embedded content]Be careful with metrics ending with “.Value”. They hold accumulative values since node’s start so use perSecond function to get rate per second.HitRate might seem redundant if Graphite has asPercent but we can’t use it now because of #207 which seems abandoned…MemtablesThere are couple of options in cassandra.yaml to tune Memtables (like memtable_cleanup_threshold or memtable_flush_writers) and this row will help you to discover eventual issues. We didn’t have any incidents with this part but always better to have such charts ready. Memtables are created per-ColumnFamily but for now we’re using aggregated metrics:[embedded content]Bloom filterAdded for the future (didn’t have any problems with this component so far) but we’re planning to tune bloom_filter_fp_chance soon so will be used to get feedback after scheduled changes.[embedded content]Snapshostsgauges.cassandra.jmx.org.apache.cassandra.metrics.ColumnFamily.SnapshotsSize.ValueThis single metrics is used to immediately see if `nodetool clearsnapshot` can be fired to save significant disk space.Hints[embedded content]Accumulative metrics to show hints across cluster.Streams[embedded content]This part is used to see how nodes are busy with streaming operations.Connected clients[embedded content]It happens (usually while restarts) that binary or thrift protocol suddenly stops to work (or isn’t started) or number of connected clients isn’t balanced. This group will tell us if something like that takes place.Most metrics we use are calculated per C* node basis. We don’t host multiple keyspaces per cluster and having charts per table wasn’t useful yet. Fortunately it’s a matter of modifying configuration file for Jolokia (through CassandraJolokia collector) and run Puppet which eventually restarts Diamond’s collectors.Our Jolokia configuration file became very long at some point so using regexps alleviate this problem a bit.

Illustration Image

Cassandra metrics and their use in Grafana

During our adventure of adopting Cassandra for sync feature we’ve been hit by many things. Most of the time it was because we weren’t proficient with C* yet and equipped with detailed knowledge and experience in many areas related to it. Sometimes it also happened because of some nasty bugs either in our infrastructure or inside database itself.

We would safe lots of energy and frustrating days at work having solid monitoring from the very beginning, allowing us to detect anomalies very early. Far too often we’re discovering metrics skyrocketing by running nodetool command during the work on usual tasks and not having proper charts with historic data. We’ve learned over time what to monitor and visualise so hopefully solution presented below will save lots of coffee and stress to anyone who’s seriously starting his journey with Cassandra. Many of changes we made to our monitoring infrastructure were dictated by incidents we had so this text is also a collection of our war stories. You can read about our infrastructure in previous posts:

Here I’ll focus on final output — charts in Grafana which is used extensively by us and is fed by couple of collecting tools of our choice. Till the end of this post I’ll omit prefix “sync.$environment.$datacenter.$host.” of each metric for readability.

At the moment we’ve two major dashboards. First one called “Sync database -general” contains generic things not strictly related to Cassandra itself but required to spot anomalies related to slow disk I/O, network issues or CPU.

Data are gathered mainly by Diamond.

CPU
image

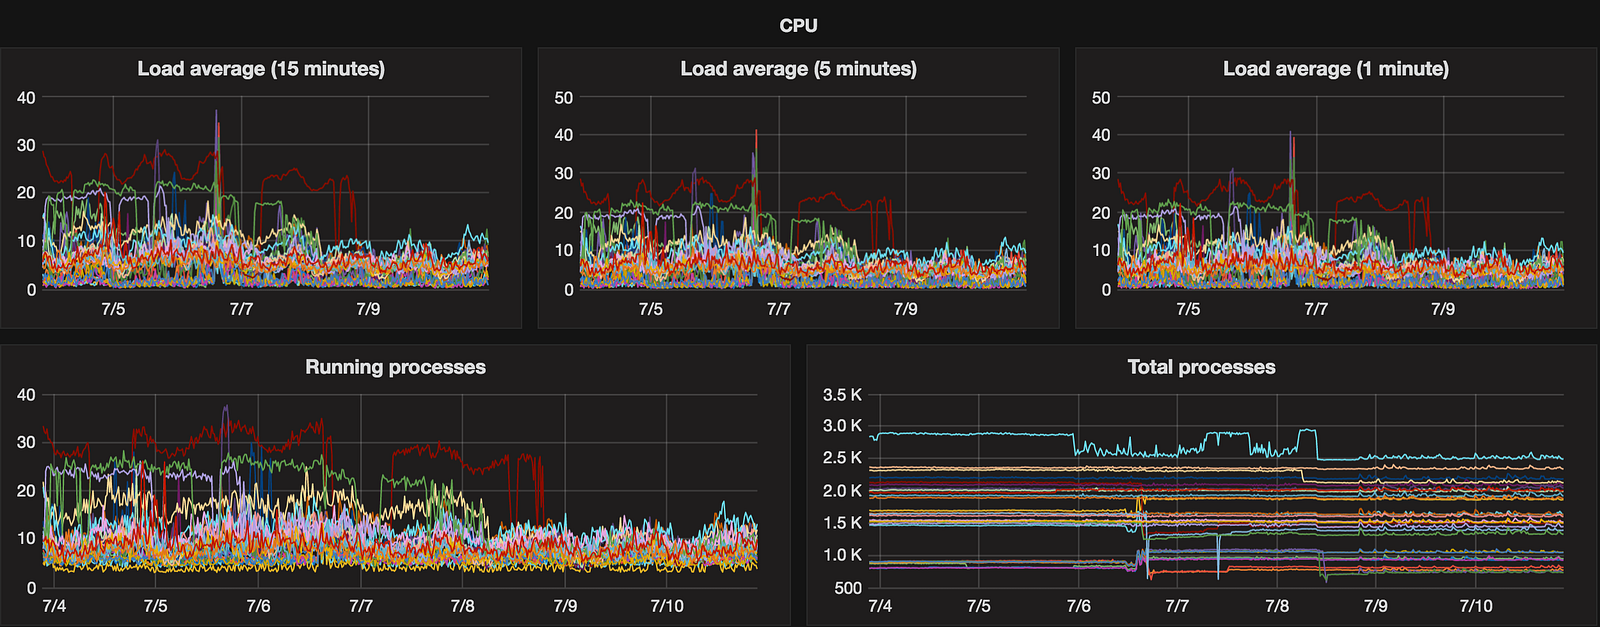
Metrics are provided by LoadAverageCollector. On several occasions we get some old hanging processes so number of total and running processes could be useful.

Memory

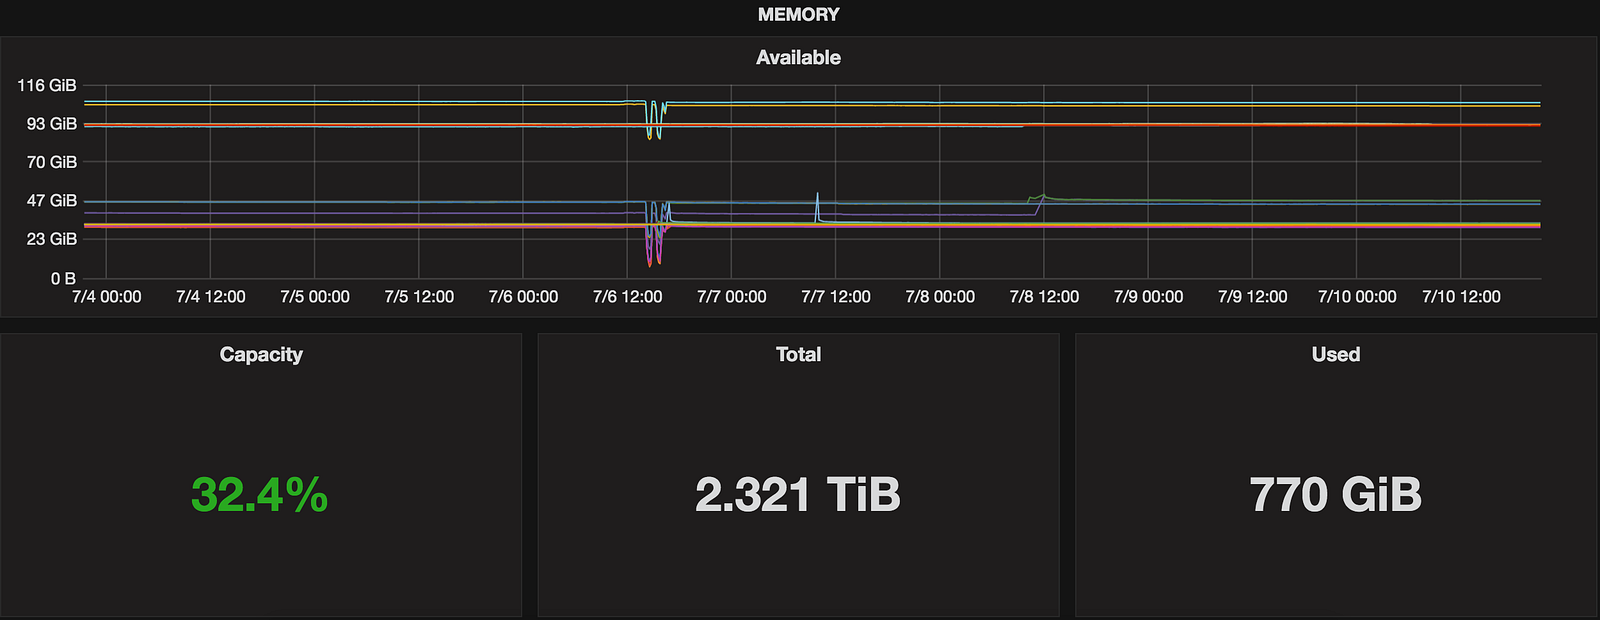
There were many memory leaks in 2.1.x branch (f.ex. CASSANDRA-9549 or CASSANDRA-9681) so this one helps out to detect them:

gauges.memory.MemAvailable

It’s important to not use MemFree here which is something very different .
image

Network

image

We’ve there f.ex:

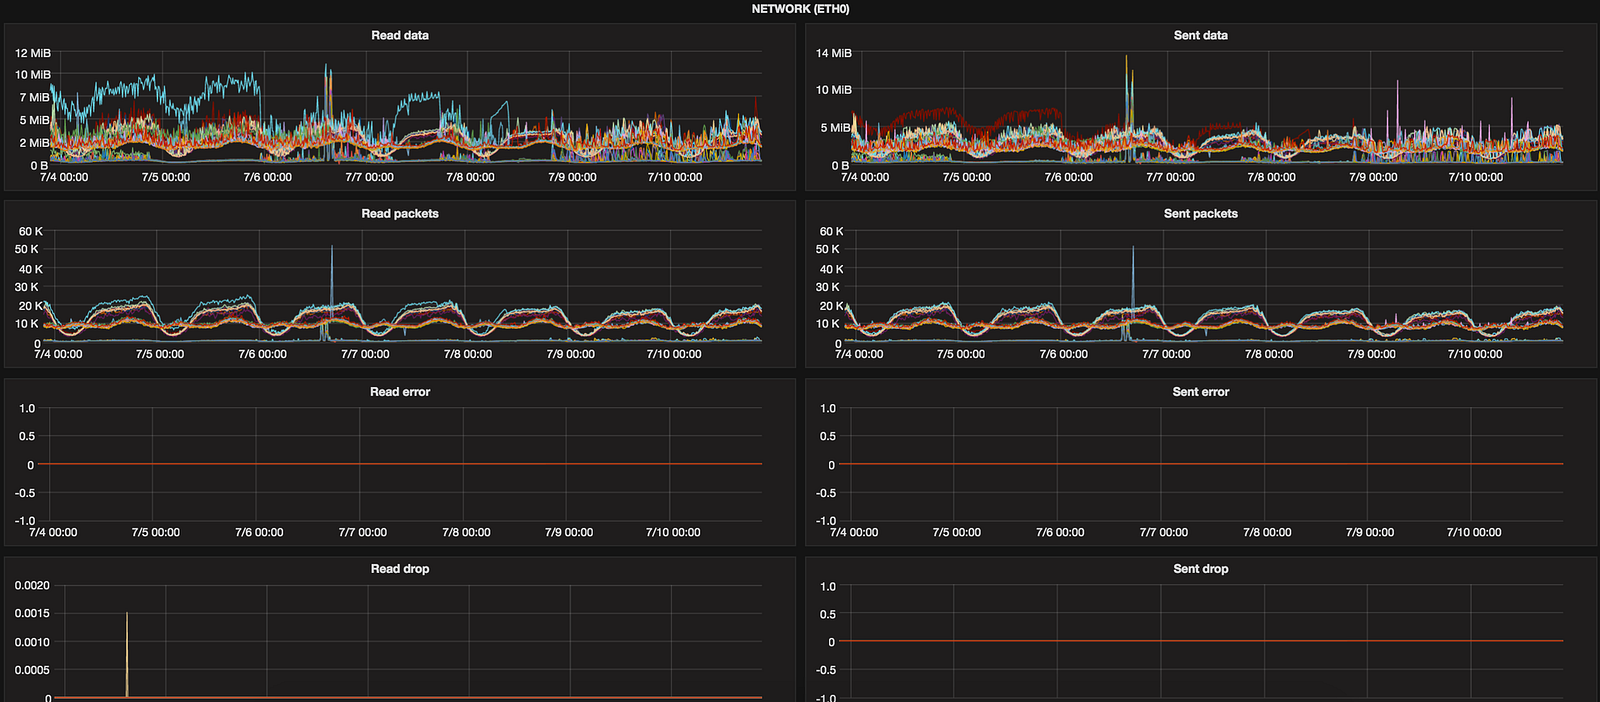
and similar for transferred data (tx_byte, tx_errors, …) handy to debug things together with NetOps team.

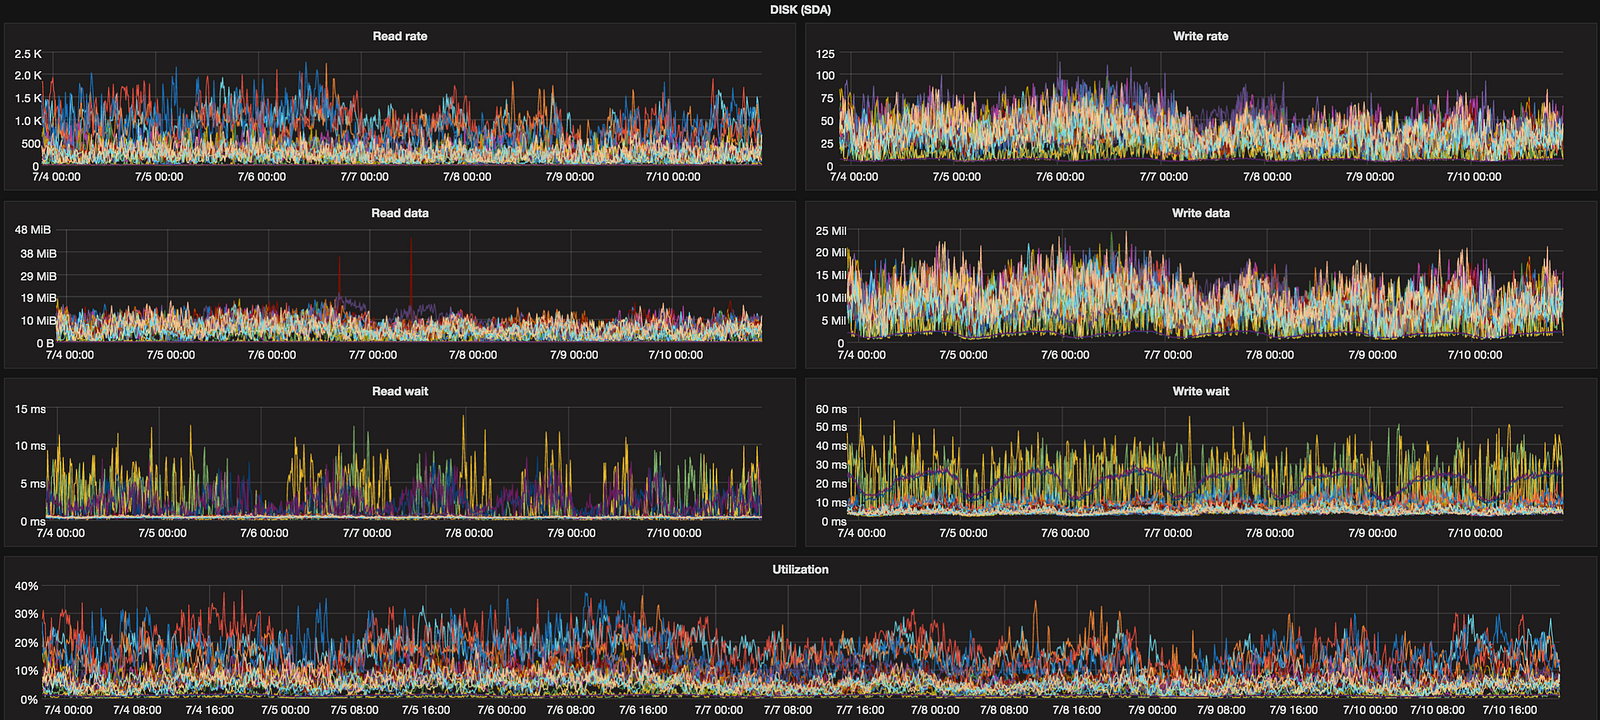
Disks
image

This is quite large group (row) but really helpful in making sure our SSD disks are behaving well and aren’t saturated. It contains metrics like:

provided by Diamond’s DiskUsageCollector.

StatsD

image

To immediately see if everything is fine with StatsD daemon, number of metrics seems reasonable and that process is handling them in rational time we’re using two simple metrics sent automatically:

statsd.numStats
statsd.processing_time

Useful to verify that everything works fine after upgrade.


The second dashboard “Sync — Cassandra” is purely about Cassandra and it was built over time while learning about new places worth to monitor or when we had suspicion that particular component isn’t working as it should.

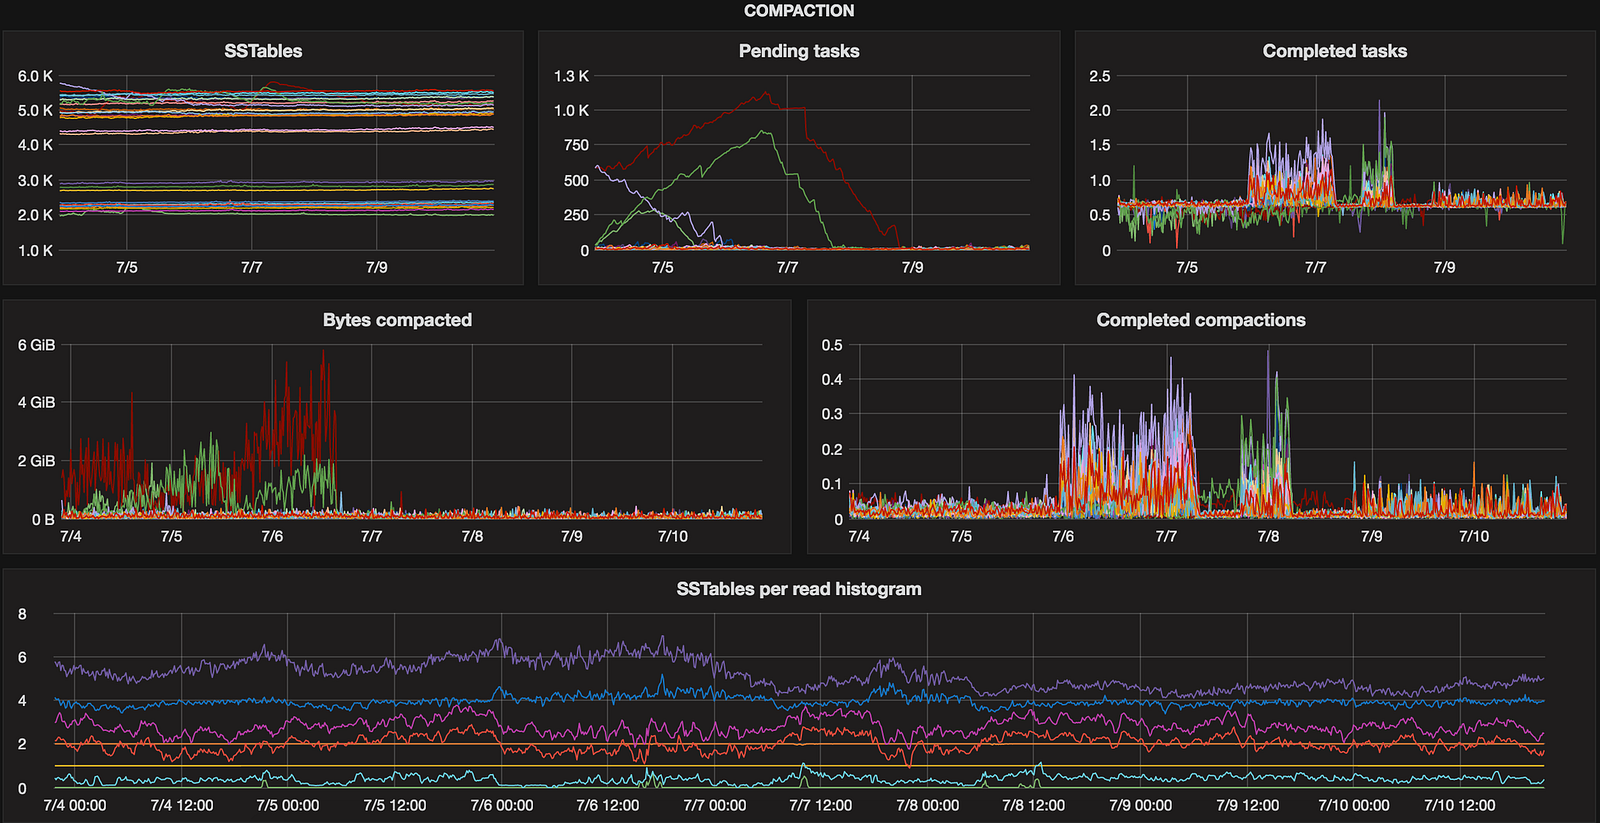
Compaction

This one is about SSTables and compaction process. It’s important to know early if compaction stuck on certain node(s), number of pending tasks is growing or SSTables count exploded. We had such incidents in the past and detecting it early or even discovering it at all saved us headaches and allowed to react quickly.
image

Compacting large partitions

image

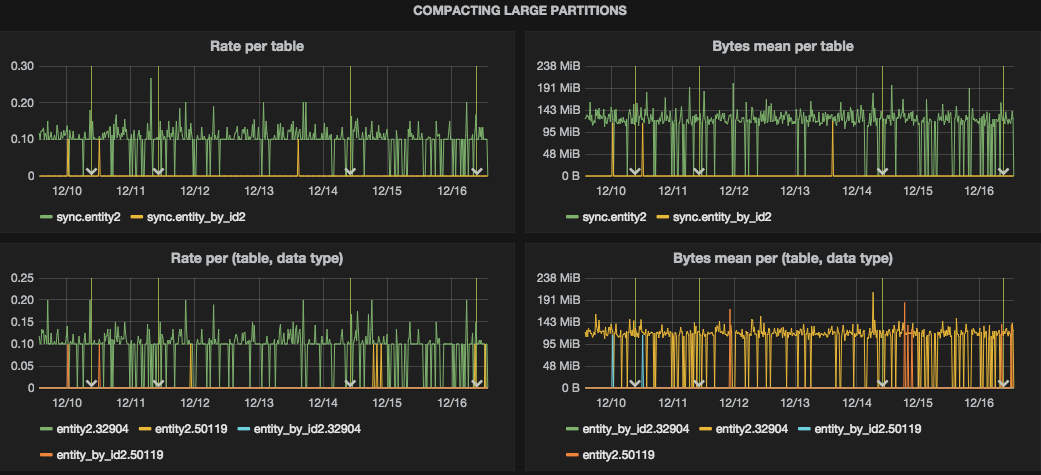
C* logs warnings while compacting partition longer than compaction_large_partition_warning_threshold_mb (cassandra.yaml). We’re using Logstash to parse these warnings and put into StatsD. Lots of such events with high numbers may indicate problems with schema.

Two charts at the bottom are specific to our project where we’ve a concept of data type used a part of composite partition key.

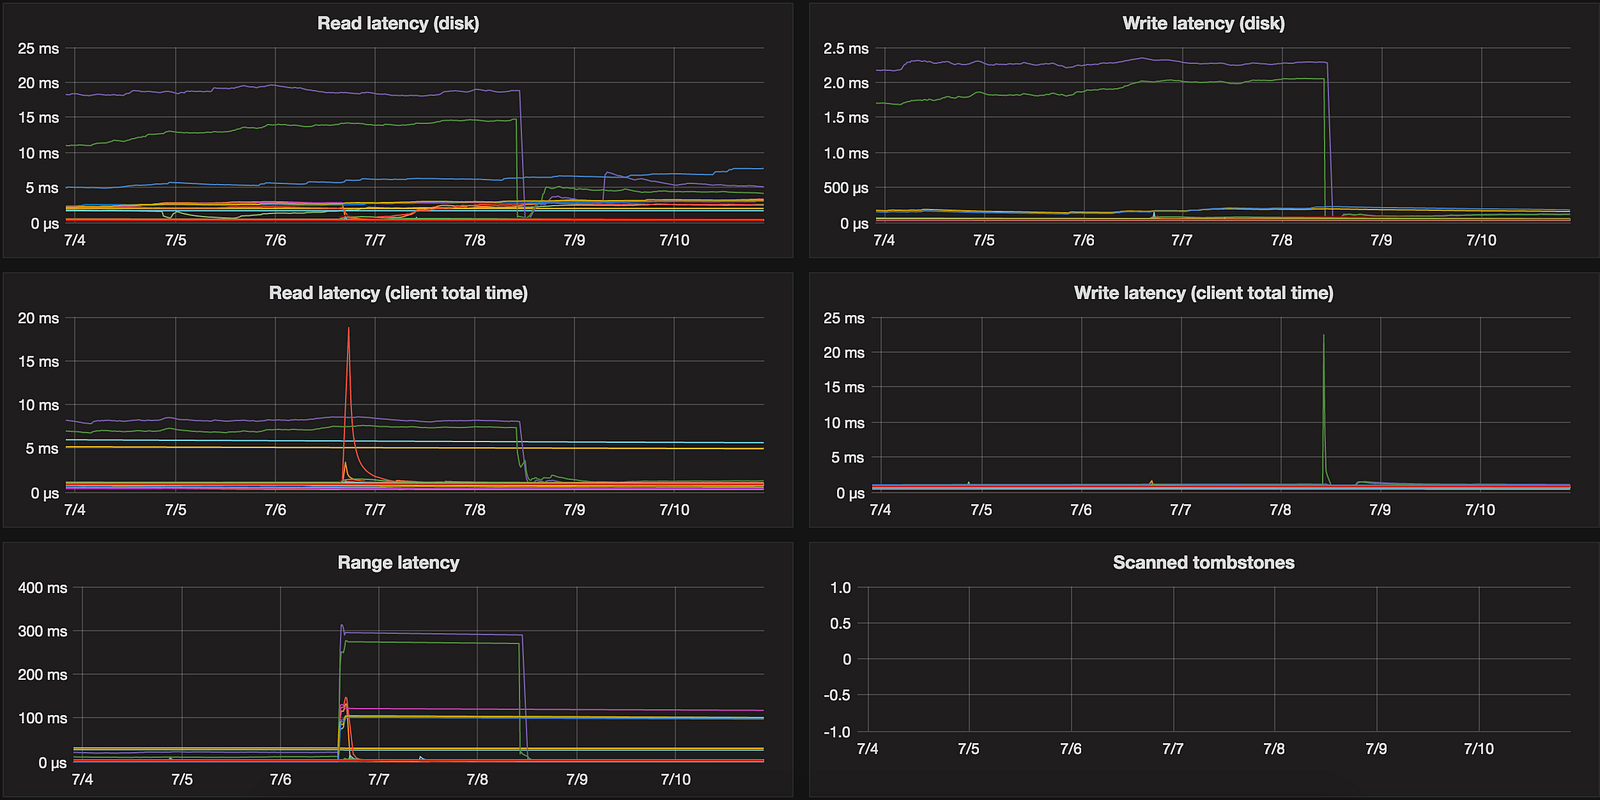
Disk
image

Cassandra provides also data about read / write latency:

“Scanned tombstones” is fed by parsing C* logs and getting warnings about scanning large number of tombstones.

Requests
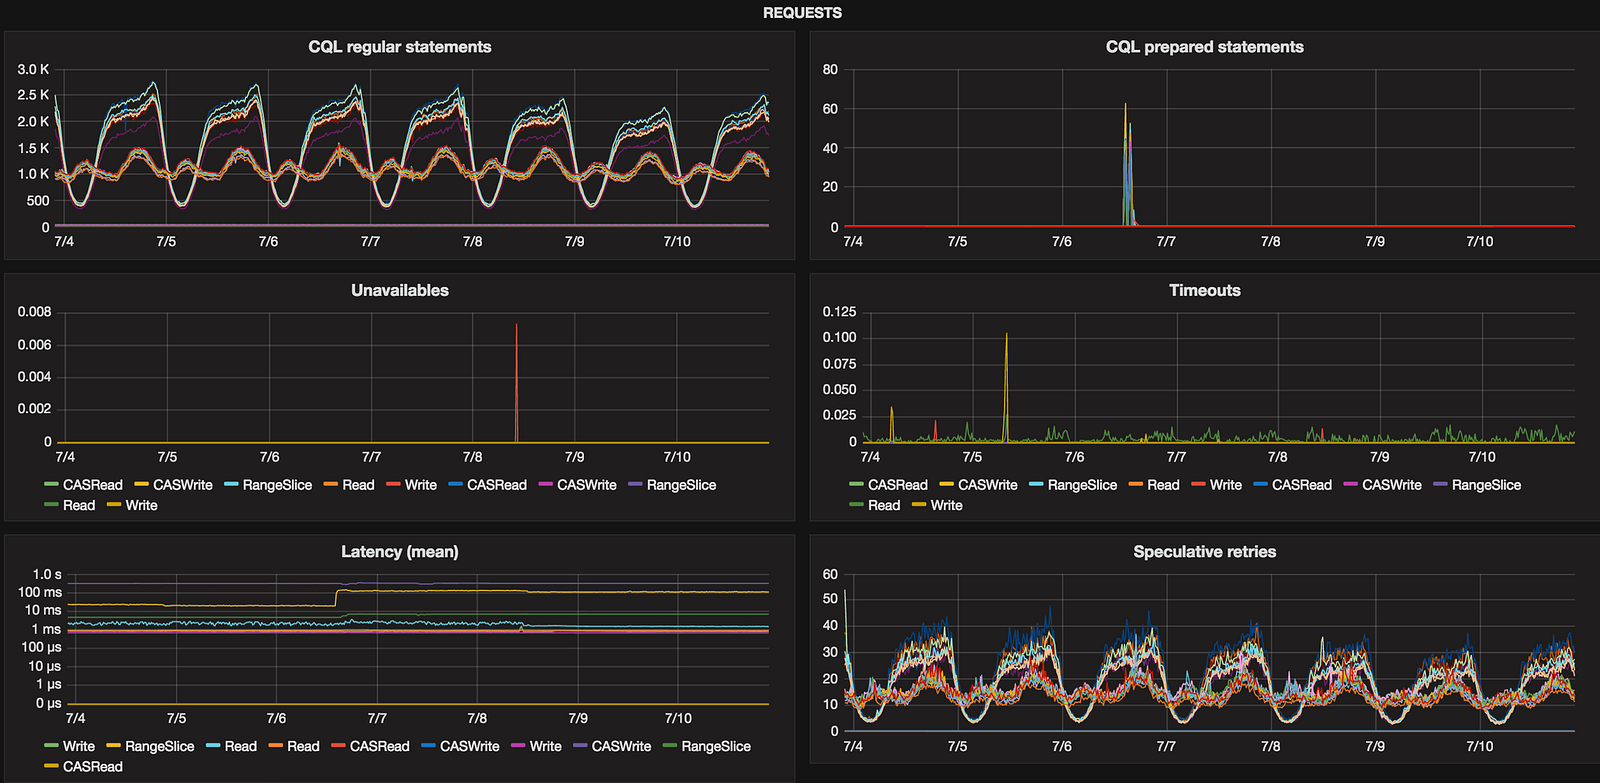
image

Errors

image

These two accumulative metrics (use perSecond to get number of occurrences per second) show if either C* throws many exceptions and would be good to grep through its system.log or it can’t connect to other nodes which might be a sign of overloaded node(s) or network issues.

Thread pools
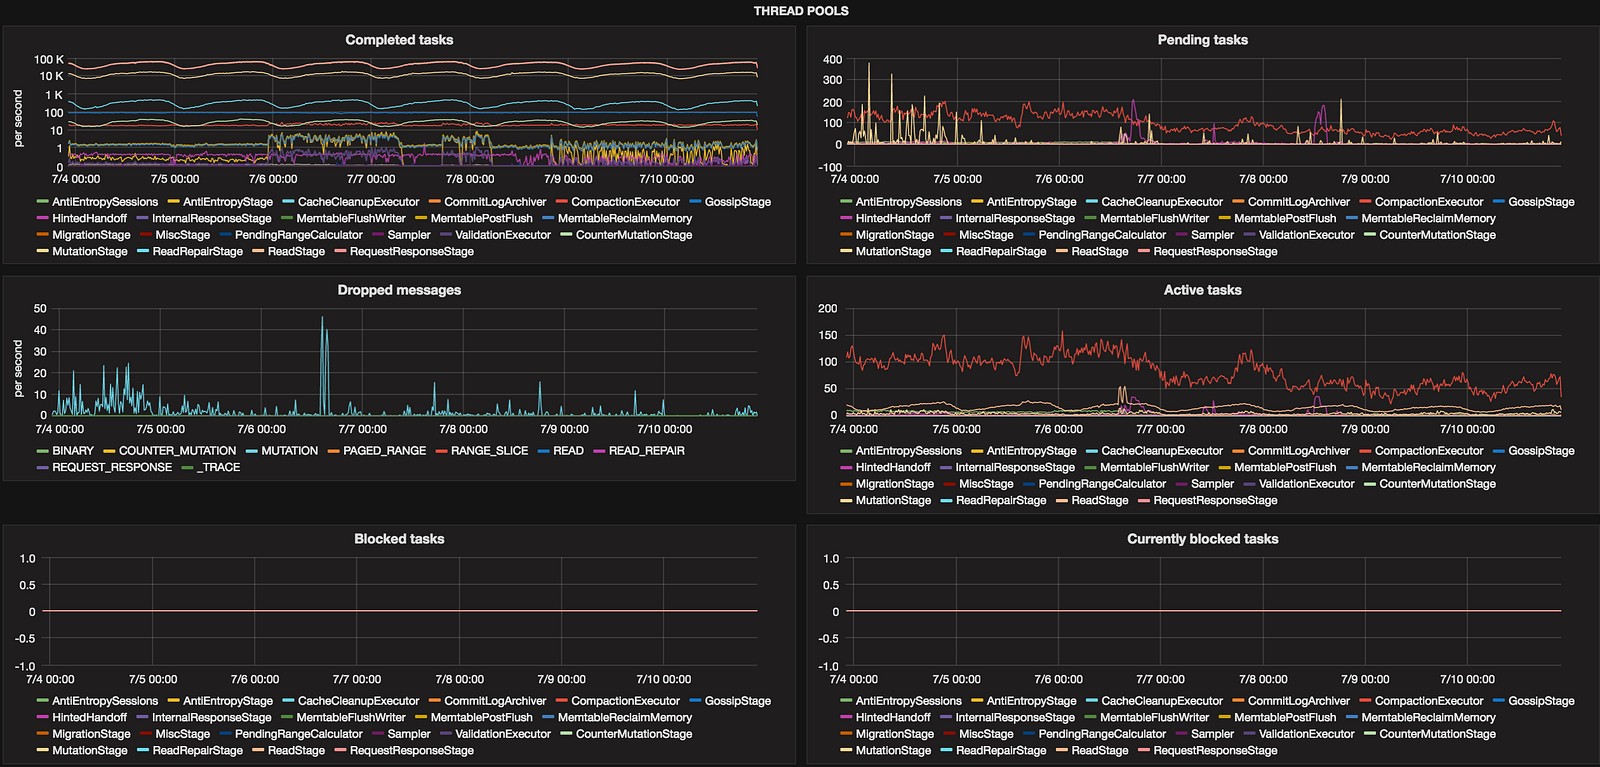
image

This might seem overwhelming but shows what threads are doing like creating Merkle trees (ValidationExecutor), compacting (CompactionExecutor) or just handling read requests.

Key cache
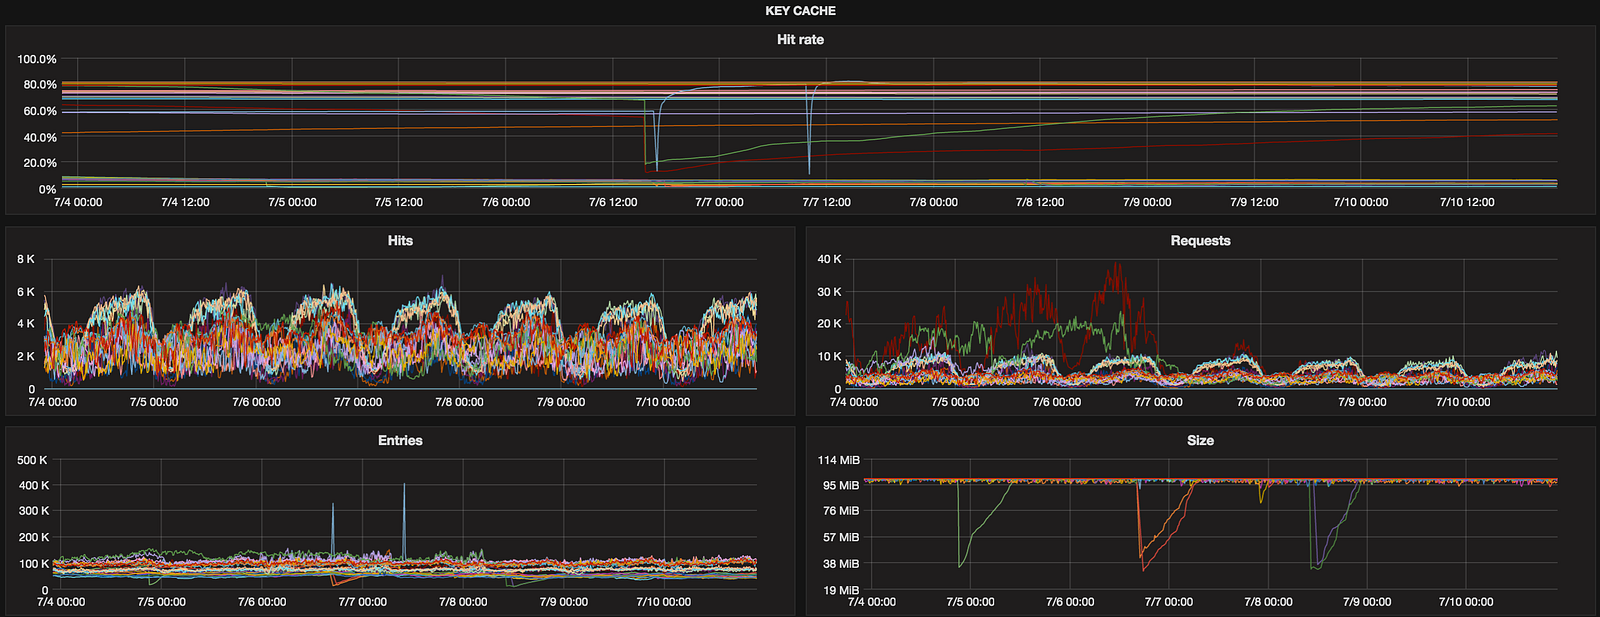
image

We don’t have hot data in Sync so row cache is disabled (row_cache_size_in_mb set to 0 in cassandra.yaml) but having charts for key cache to monitor its performance is precaution to save our time in the future.

Be careful with metrics ending with “.Value”. They hold accumulative values since node’s start so use perSecond function to get rate per second.

HitRate might seem redundant if Graphite has asPercent but we can’t use it now because of #207 which seems abandoned…

Memtables

There are couple of options in cassandra.yaml to tune Memtables (like memtable_cleanup_threshold or memtable_flush_writers) and this row will help you to discover eventual issues. We didn’t have any incidents with this part but always better to have such charts ready. Memtables are created per-ColumnFamily but for now we’re using aggregated metrics:

Bloom filter
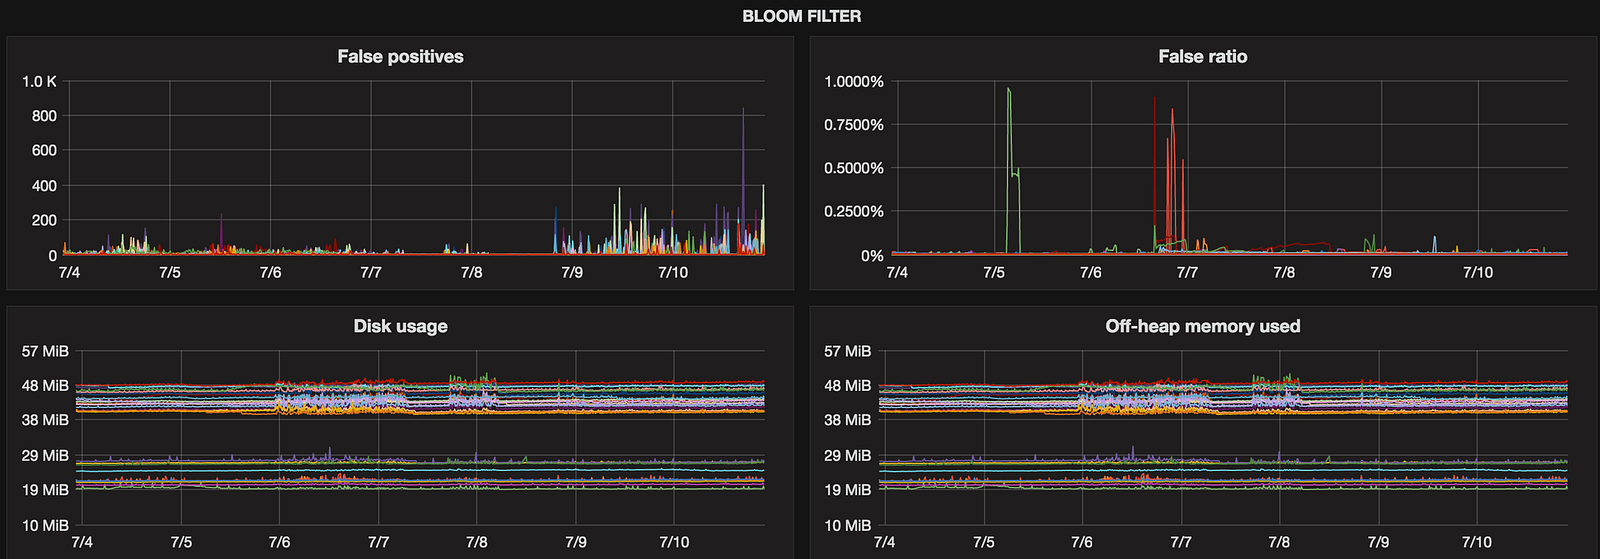
image

Added for the future (didn’t have any problems with this component so far) but we’re planning to tune bloom_filter_fp_chance soon so will be used to get feedback after scheduled changes.

Snapshosts

gauges.cassandra.jmx.org.apache.cassandra.metrics.ColumnFamily.SnapshotsSize.Value

This single metrics is used to immediately see if `nodetool clearsnapshot` can be fired to save significant disk space.

Hints

Accumulative metrics to show hints across cluster.

Streams

image

This part is used to see how nodes are busy with streaming operations.

Connected clients

It happens (usually while restarts) that binary or thrift protocol suddenly stops to work (or isn’t started) or number of connected clients isn’t balanced. This group will tell us if something like that takes place.


Most metrics we use are calculated per C* node basis. We don’t host multiple keyspaces per cluster and having charts per table wasn’t useful yet. Fortunately it’s a matter of modifying configuration file for Jolokia (through CassandraJolokia collector) and run Puppet which eventually restarts Diamond’s collectors.

Our Jolokia configuration file became very long at some point so using regexps alleviate this problem a bit.

Related Articles

monitoring
cassandra

Cassandra Summit Recap: Diagnosing Problems in Production - RustyRazorblade.com

John Doe

3/1/2023

monitoring
cassandra
performance

Checkout Planet Cassandra

Claim Your Free Planet Cassandra Contributor T-shirt!

Make your contribution and score a FREE Planet Cassandra Contributor T-Shirt! 
We value our incredible Cassandra community, and we want to express our gratitude by sending an exclusive Planet Cassandra Contributor T-Shirt you can wear with pride.

Join Our Newsletter!

Sign up below to receive email updates and see what's going on with our company

Explore Related Topics

AllKafkaSparkScyllaSStableKubernetesApiGithubGraphQl

Explore Further

monitoring