Last week at the Cassandra Summit I gave a talk with Blake Eggleston on diagnosing performance problems in production. We spoke to about 300 people for about 25 minutes followed by a healthy Q&A session. I've expanded on our presentation to include a few extra tools, screenshots, and more clarity on our talking points.
There's finally a lot of material available for someone looking to get started with Cassandra. There's several introductory videos on YouTube by both me and Patrick McFadin as well as videos on time series data modeling. I've posted videos for my own project, cqlengine, (intro & advanced), and plenty more on the PlanetCassandra channel. There's also a boatload of getting started material on PlanetCassandra written by Rebecca Mills.
This is the guide for what to do once you've built your application and you're ready to put Cassandra in production. Whether you've been in operations for years or you are first getting started, this post should give you a good sense of what you need in order to address any issues you encounter.
The original slides are available via Slideshare.
Update: the presentation is now available on YouTube!
Before you even put your cluster under load, there's a few things you can set up that will help you diagnose problems if they pop up.
-
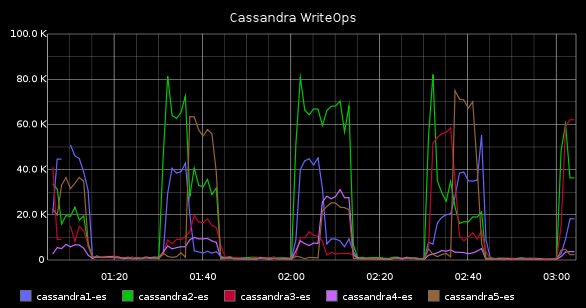
Ops center
This is the standard management tool for Cassandra clusters. This is recommended for every cluster. While not open source, the community version is free. It gives you a high level overview of your cluster and provides historical metrics for the most important information. It comes with a variety of graphs that handle about 90% of what you need on a day to day basis.

-
Metrics plugins
Cassandra has since version 1.1 included the metrics library. In every release it tracks more metrics using it. Why is this awesome? In previous persons of Cassandra, the standard way to access what was going on in the internals was over JMX, a very Java centric communications protocol. That meant writing a Java Agent, setting up mx4j, or Jolokia, then digging through JMX, which can be a little hairy. Not everyone wants to do this much work.
The metrics library allows you to tell Cassandra to report its internal, table level metrics out to a whole slew of different places. Out to CSV, Ganglia, Graphite, and STDOUT, and it's pluggable to push metrics to anywhere you want.

-
Munin, Nagios, Icinga (or other system metrics monitoring)
I've found these tools to be incredibly useful at graphing system metrics as well as custom application metrics. There are many options. If you're already familiar with one tool, you can probably keep using it. There are hosted solutions as well (server density, data dog, etc)
-
Statsd, Graphite, Grafana
Your application should be tracking internal metrics. Timing queries, frequently called functions, etc. These tools let you get a profile of what's going on with your code in production. Statsd collects raw stats and aggregates them together, then kicks them to graphite. Grafana is an optional (better) front end to Graphite.
There was a great post by etsy, Measure Anything, Measure Everything, that introduced statsd and outlined its usage with Graphite.
-
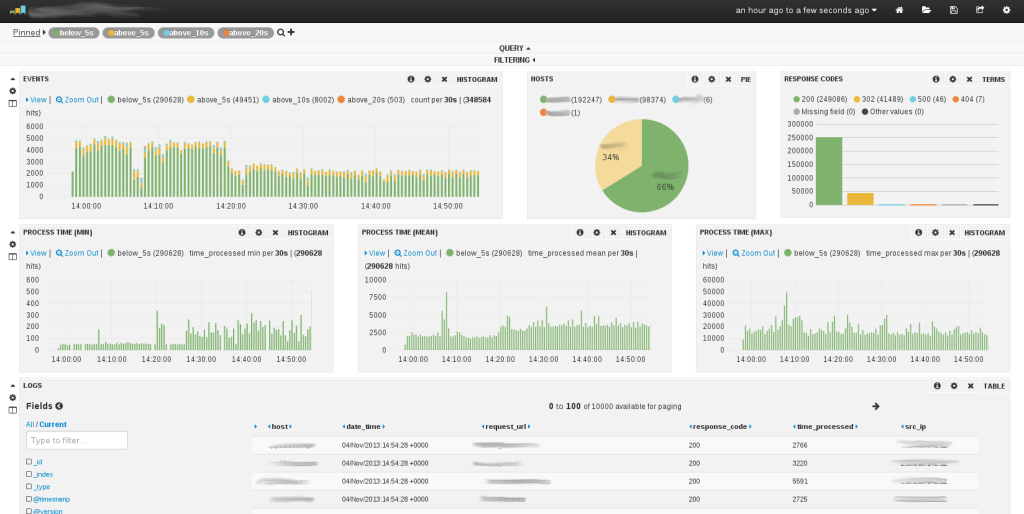
Logstash
We didn't mention Logstash in our presentation, but we've found it to be incredibly useful in correlating application issues with other failures. This is useful for application logging aggregation. If you don't want to host your own log analysis tool, there are hosted services for this as well.
There's a bunch of system tools that are useful if you're logged onto a machine and want to see real time information.
-
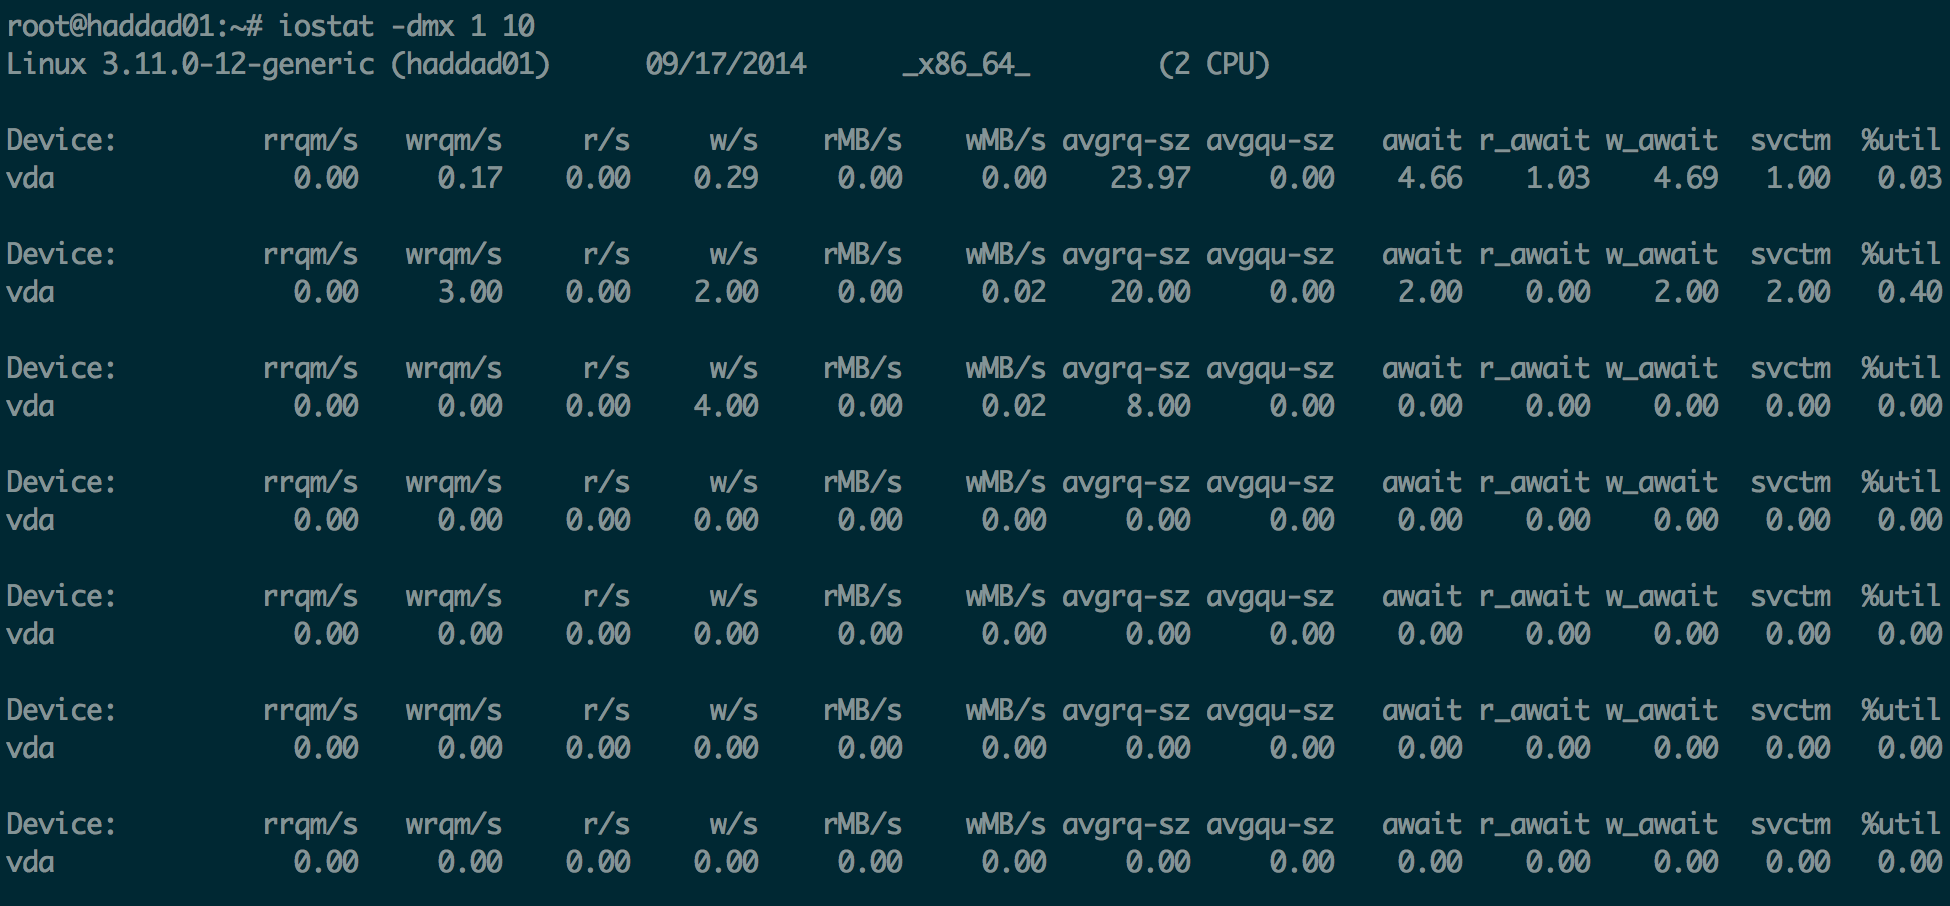
iostat
iostat is useful for seeing what's happening with each disk on your machine. If you're hitting I/O issues, you'll see it here. Specifically, you're looking for high read & write rates and a big avgqu-sz (disk queue), or a high svctm (service time) there's a good chance you're bottlenecked on your disk. You either want to use more disks or faster disks. Cassandra loves SSDs.
-
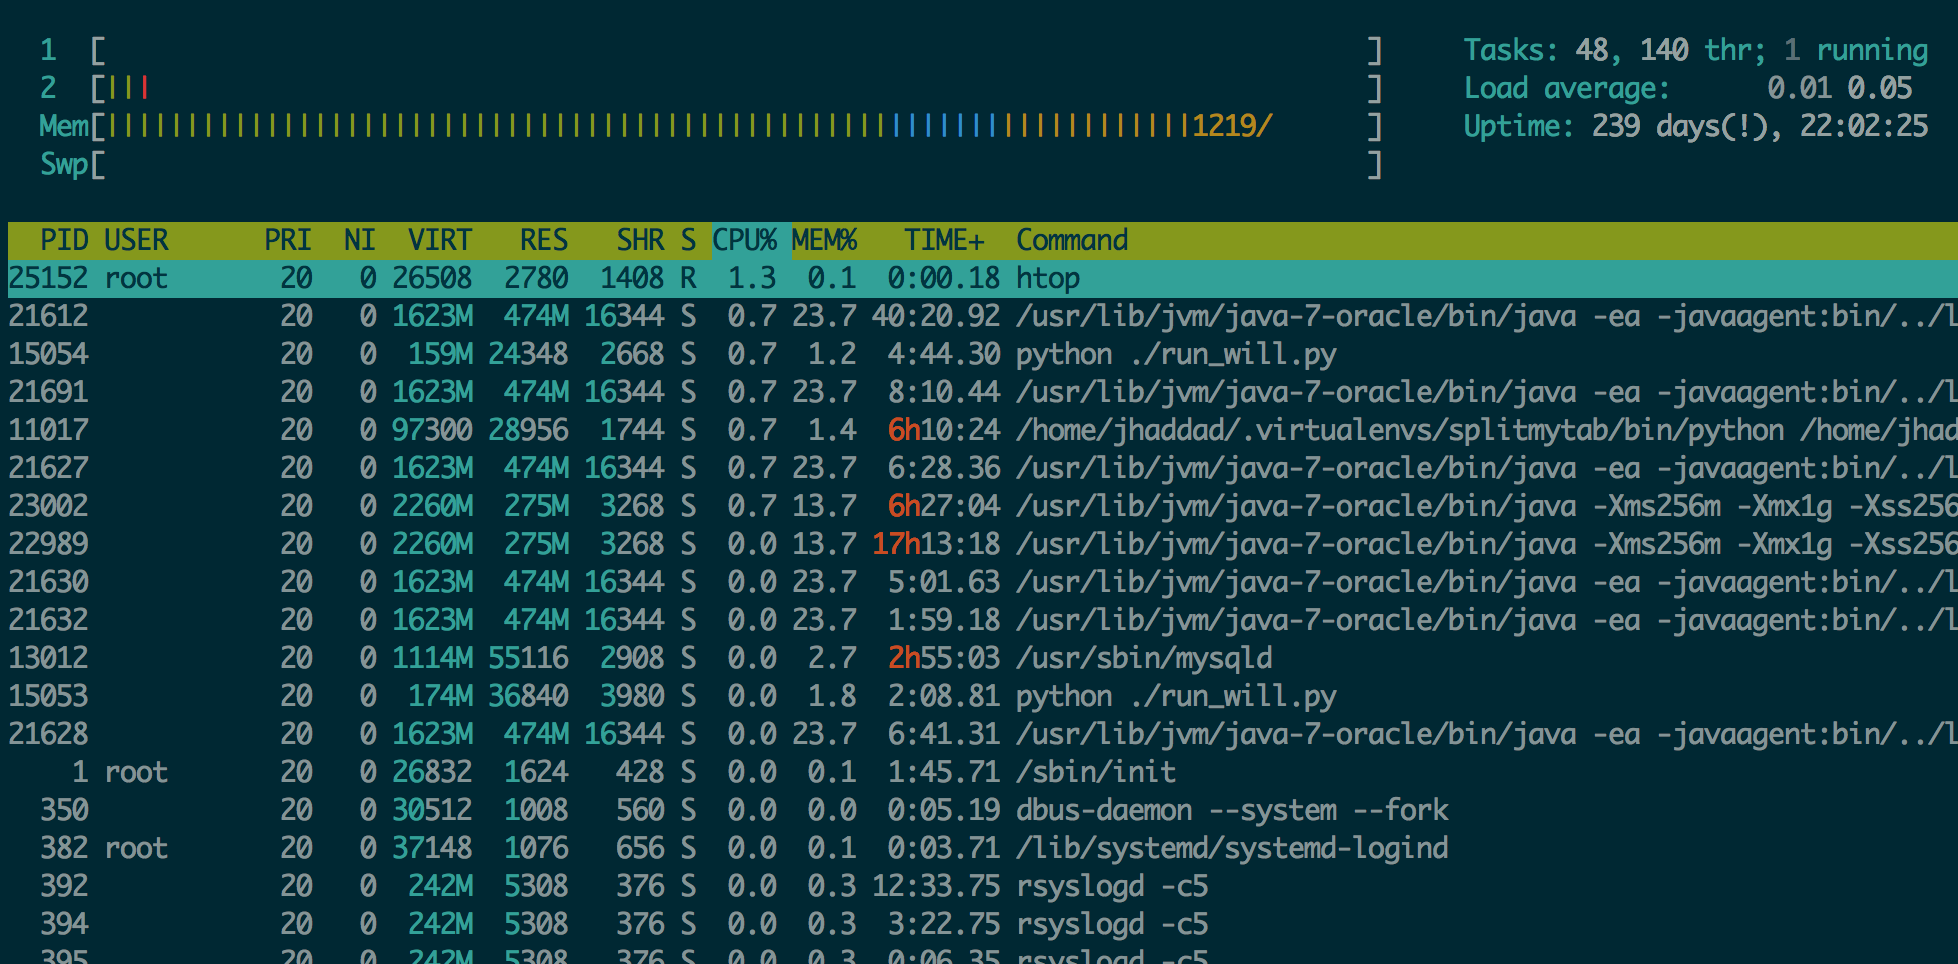
htop
Htop is a better version of top, which is useful for getting a quick glance at your system. It shows load, running processes, memory usage, and a bunch of other information at a quick glance.
-
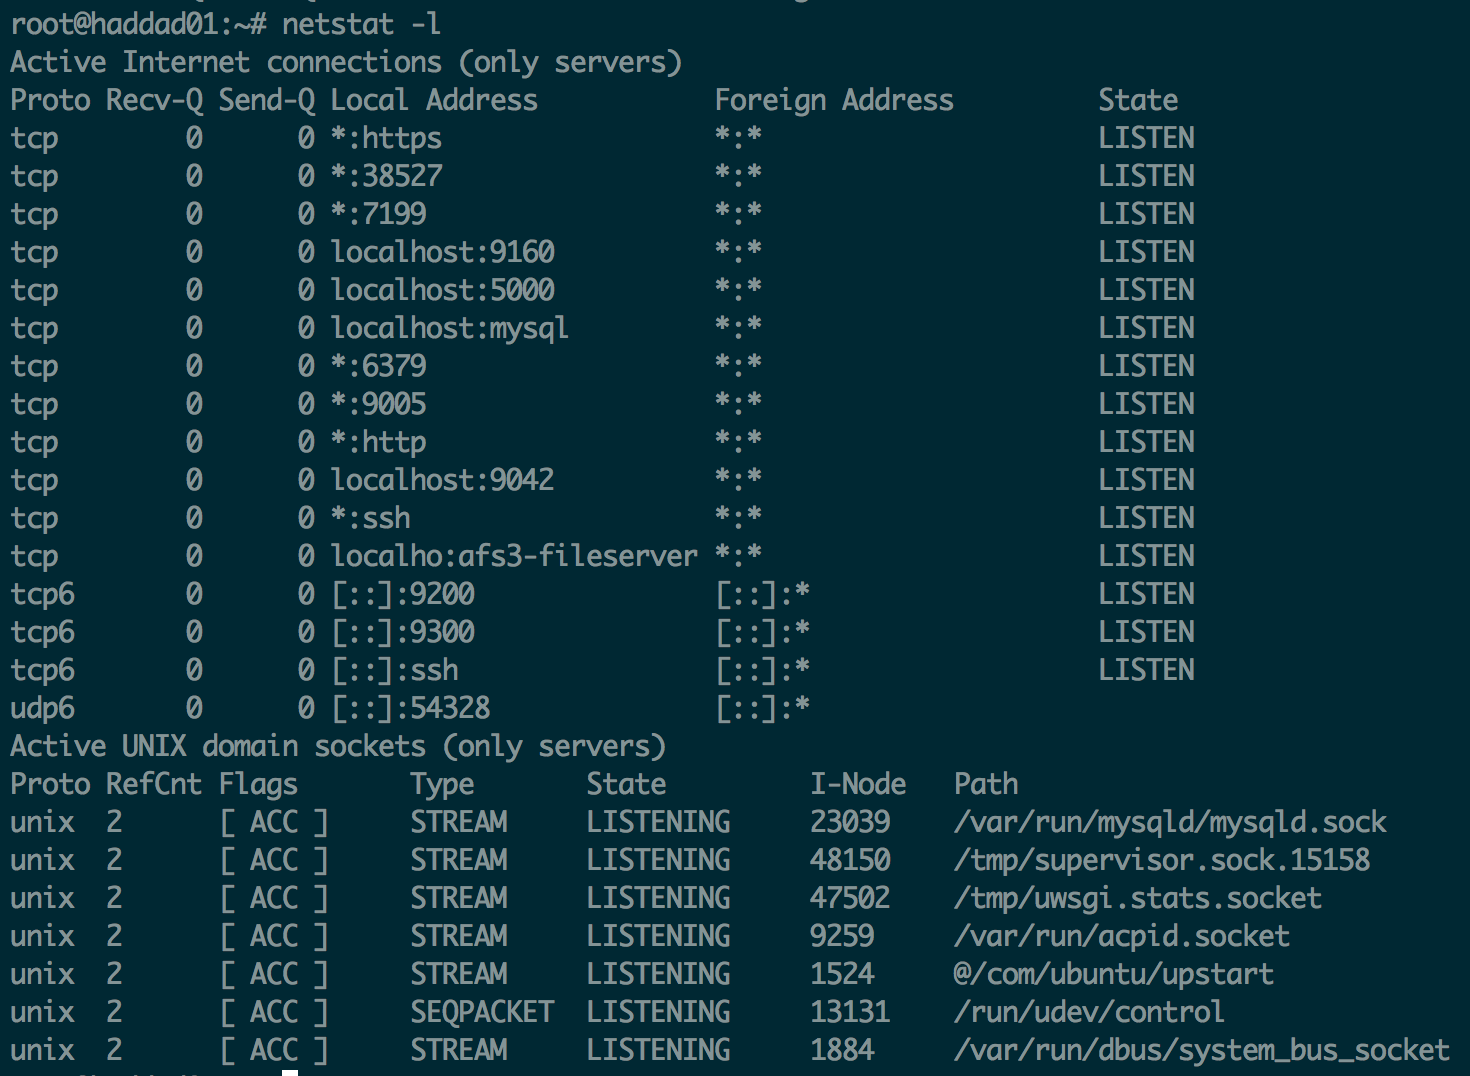
iftop & netstat
iftop is like top, but shows you active connections and the transfer rates between your server and whoever is at the other end.
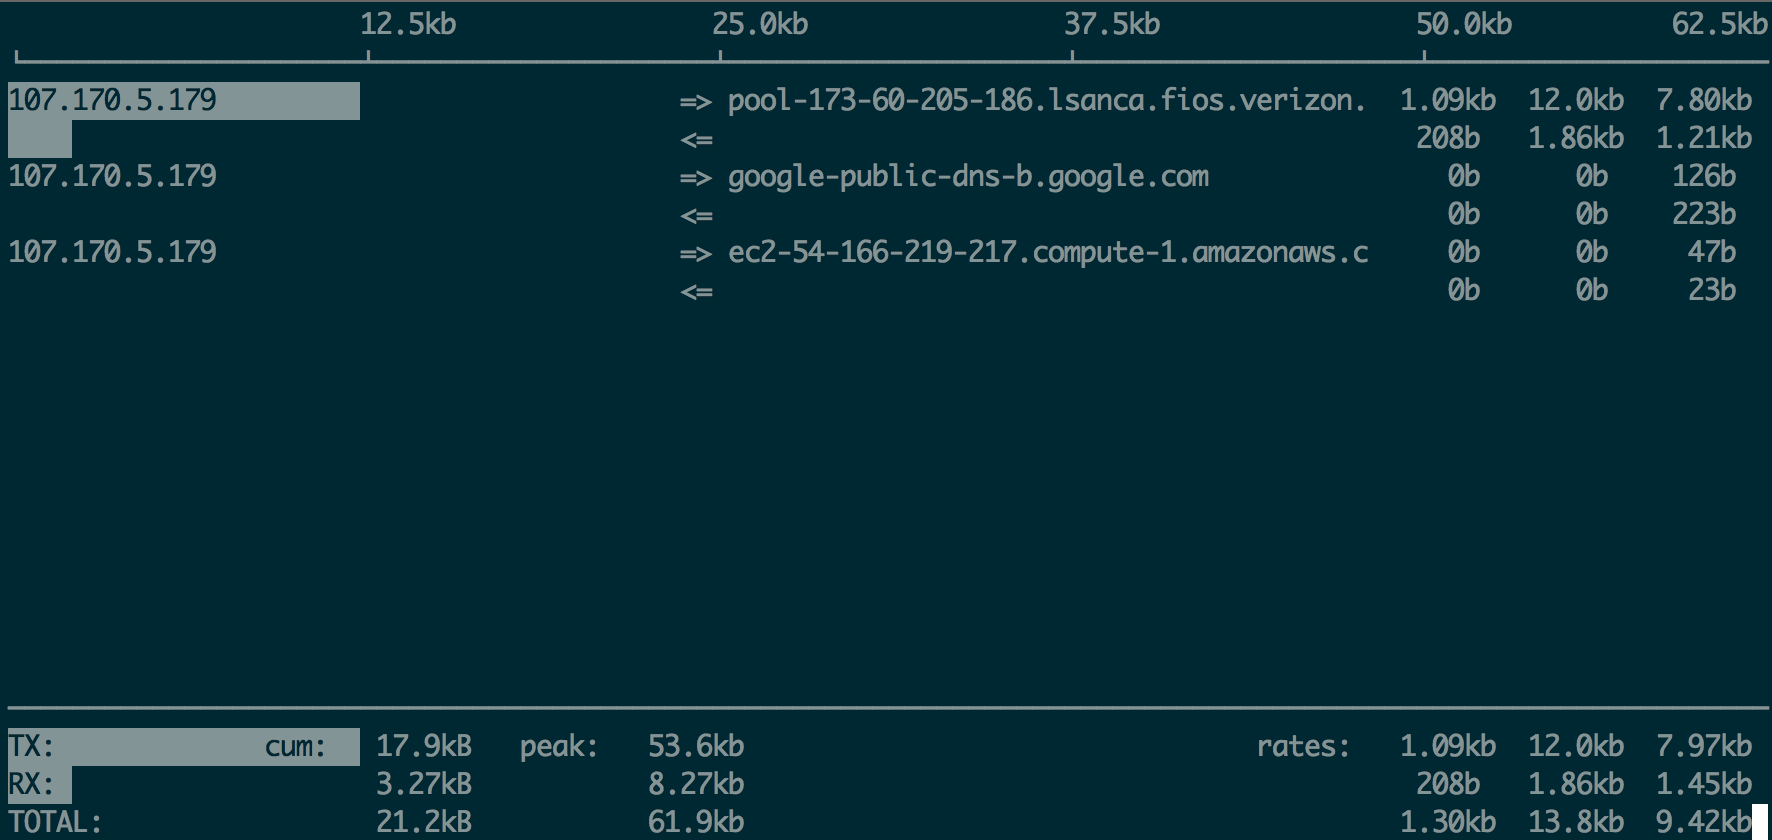
Netstat is more of a networking swiss army knife. You can see network connections, routing tables, interface statistics, and a variety of other network information.
-
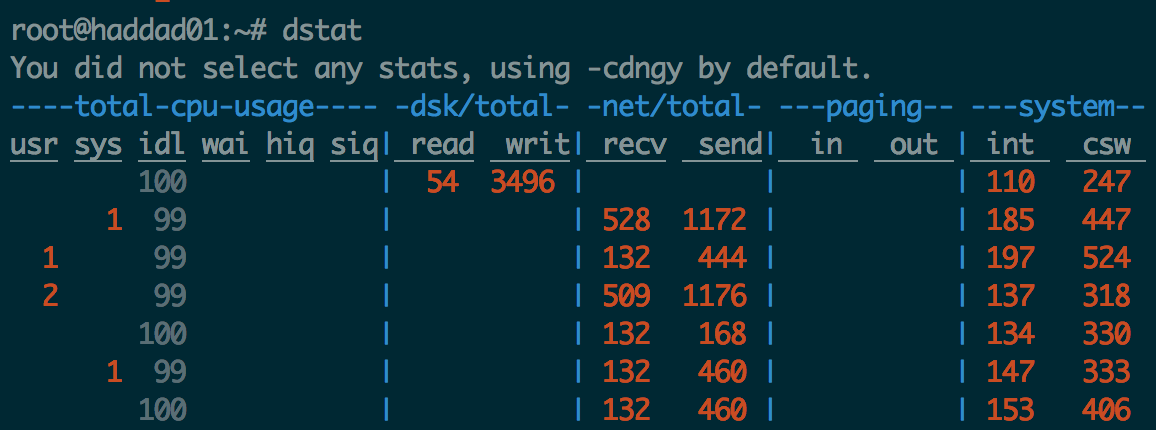
dstat
I prefer to use dstat over iostat now since it includes all of its functionality and much of the functionality of other tools as well.
-
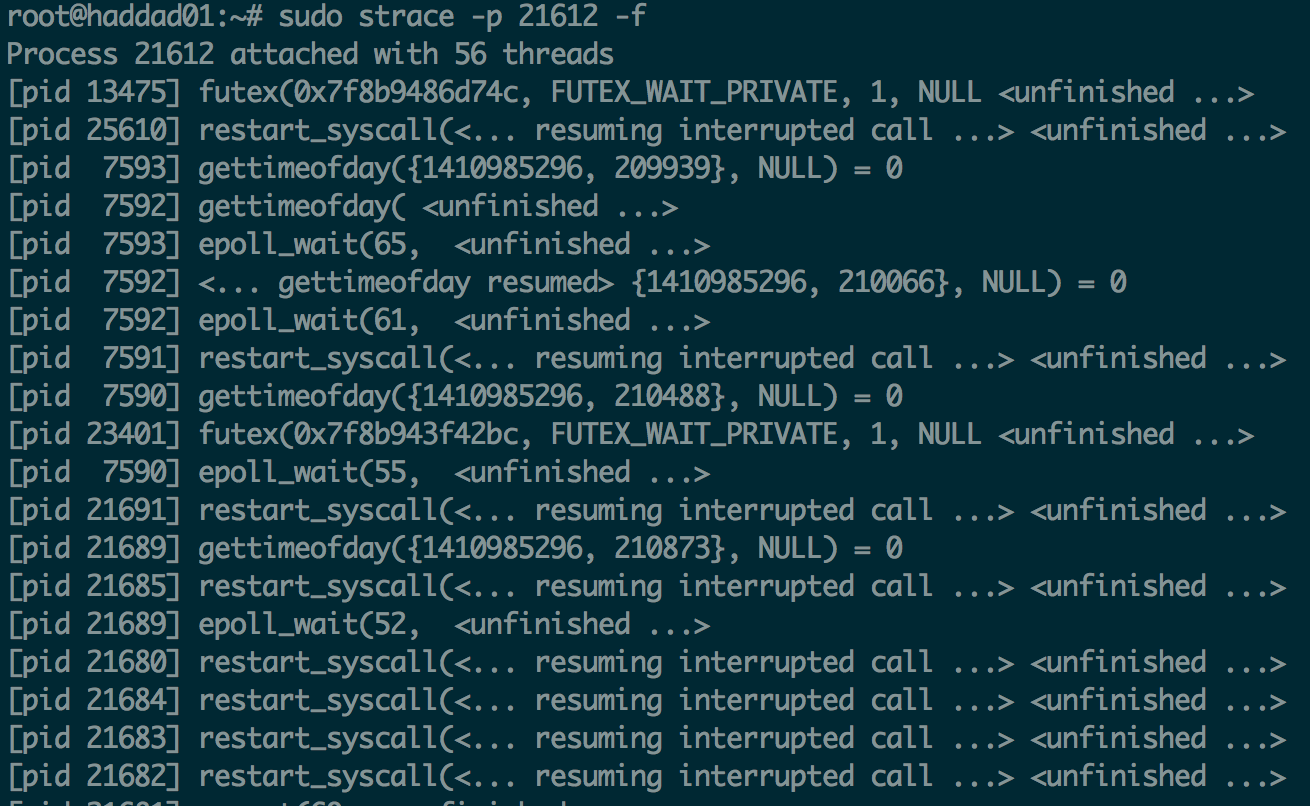
strace
strace is useful when you want to know what system calls are happening for a given process.
-
pcstat
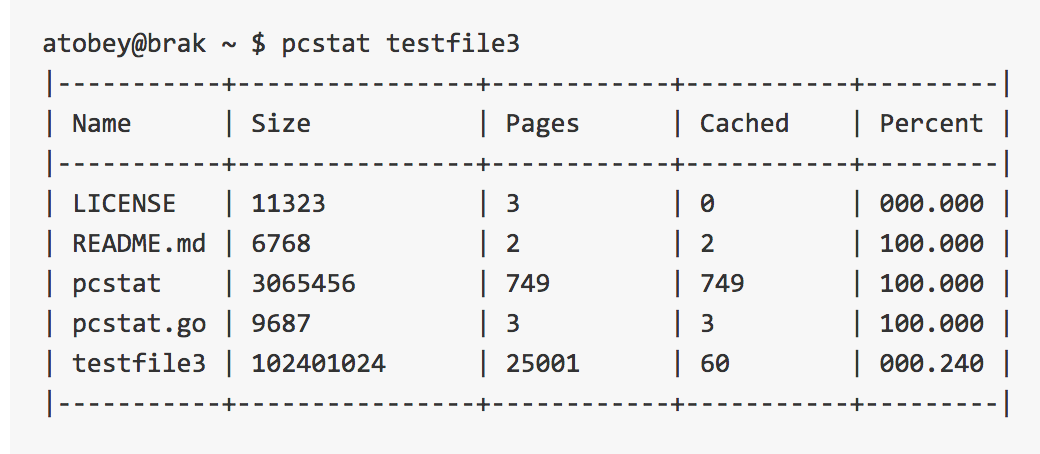
This tool, written by Al Tobey, allows you to examine a bunch of files and quickly determine how much of each file is in the buffer cache. If you're trying to figure out why table access is slow, this tool can tell you if your data is in cache already or if you have to go out to disk. Here's a good read to get familiar with buffer cache. Check out the repo.
There's a few issues that are easy to run into that I'd consider "gotchas", things that come up often enough that they're worth mentioning.
Clock skew
A important design decision in Cassandra is that it uses last write wins when there are two inserts, updates, or deletes to a cell. To determine the last update, Cassandra uses the system clock (or the client can specify the time explicitly). If server times are different, the last write may not actually win, it'll be the one that's the most skewed into the future.
To address this issue, always make sure your clocks are synced. Ntpd will constantly correct for drift. ntpdate will perform a hard adjustment to your system clock. Ntpdate needs to be used if you clock is significantly off, and ntpd will keep it at the correct time.

Disk space not reclaimed
if you add new nodes to a cluster, each replica is responsible for less data. it's streamed to the new nodes. however, it is not removed from the old nodes. If you're adding new nodes because you're running low on disk space, this is extremely important. You are required to run nodetool cleanup in order to reclaim that disk space. This is a good idea any time you change your database topology.
Issues adding nodes, or running repairs
There are two common problems that come up with repair. The first is that repairs take forever in 2.0. This is solved in 2.1 which uses an incremental repair, and does not repair data which has already been repaired. The second issue relates to trying to repair (or add nodes) to a cluster when the versions do not match. It is, in general, not a good idea (yet) to stream data between servers which are of different versions. It will appear to have started, but will just hang around doing nothing.
Cassandra comes with several tools to help diagnose performance problems. They are available via nodetool, Cassandra's multipurpose administration tool.
Compaction
Compaction is the process of merging SSTables together. It reduces the number of seeks required to return a result. It's a necessary part of Cassandra. If not configured correctly, it can be problematic. You can limit the I/O used by compaction by using nodetool setcompactionthroughput.
There's 2 types of compaction available out of the box. Size Tiered is the default and great for write heavy workloads. Leveled compaction is good for read & update heavy workloads, but since it uses much higher I/O it's recommended you use this only if you're on SSD. I recommend reading through the documentation to understand more about which is right for your workload.

Cfstats and Histograms
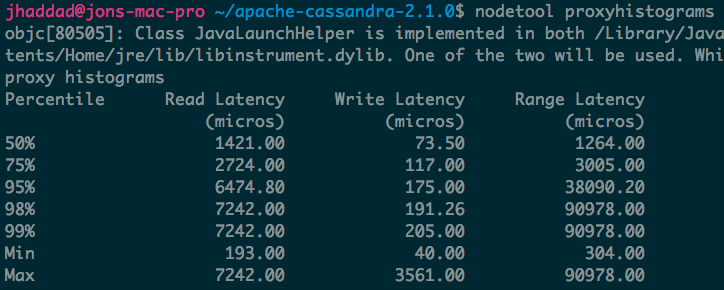
Histograms let you quickly understand at both a high level and table level what your performance looks like on a single node in your cluster. The first histogram, proxyhistograms, give you a quick top level view of all your tables on a node. This includes network latency. Histogram output has changed between versions to be more user friendly. The screenshot below is from Cassandra 2.1.
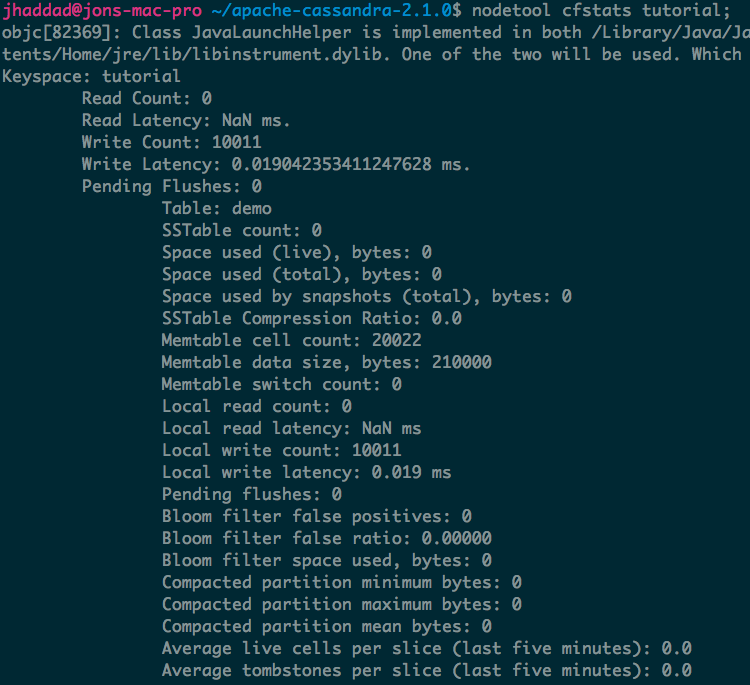
If you'd like to find out if you've got a performance problem isolated to a particular table, I suggest first running nodetool cfstats on a keyspace. You'll be able to scan the list of tables and see if there's any abnormalities. You'll be able to quickly tell which tables are queried the most (both reads and writes).
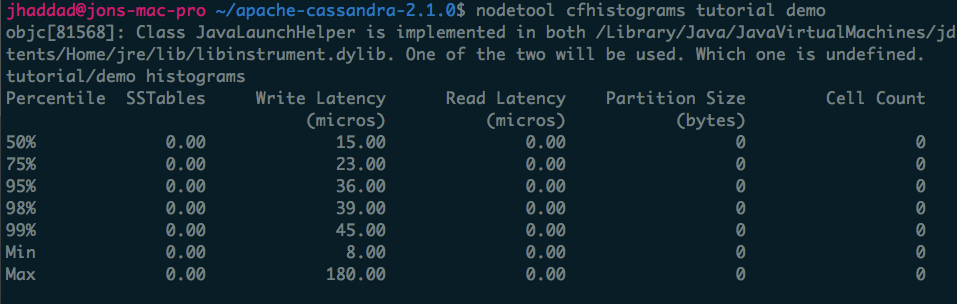
nodetool cfhistograms lets you identify performance problems with a single table on a single node. The statistics are more easily read in Cassandra 2.1.
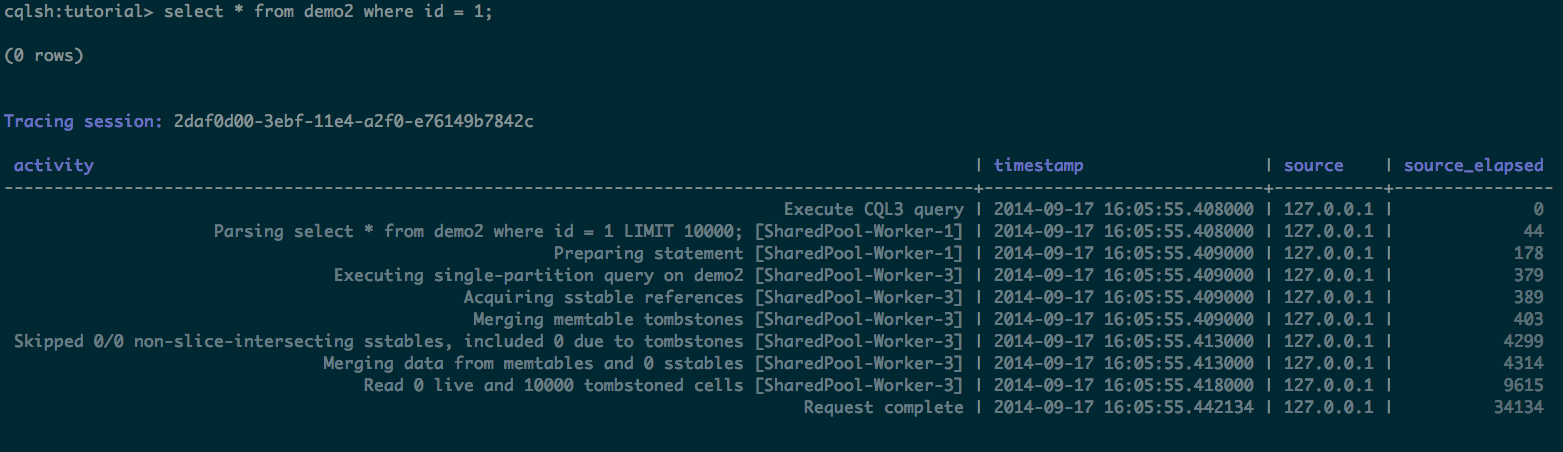
Query Tracing
If you've narrowed down your problem to a particular table, you can start to trace the queries that you execute. If you're coming from a something like MySQL, you're used to the command explain, which tells in in advance what the query plan is for a given query. Tracing takes a different approach. Instead of showing a query plan, query tracing keeps track of the events in the system whewn it actually executes. Here's an example where we've created a whole bunch of tombstones on a partition. Even on a SSD you still want to avoid a lot of tombstones - it's disk, CPU, and memory intensive.
The JVM gets a reputation for being a bit of a beast. It's a really impressive feat of engineering, but it shouldn't be regarded as black magic. I strongly recommend reading through Blake Eggleston's post on the JVM, it's well written and does a great job of explaining things. (Much better than I would here).
OK - we've got all these tools under our belt. Now we can start to narrow down the problem.
-
Are you seeing weird consistency issues, even on consistency level ALL?
It's possible you're dealing with a clock sync issue. If you're sending queries really close to one another, they might also be getting the same millisecond level timestamp due to an async race condition in your code. If you're sending lots of writes at the same time to the same row, you may have a problem in your application. Try to rethink your data model to avoid this. -
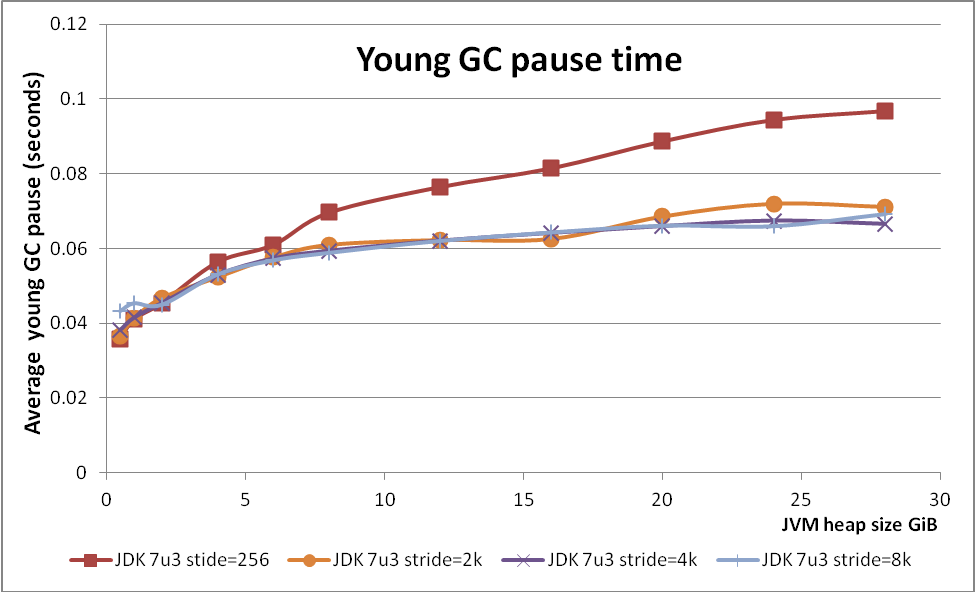
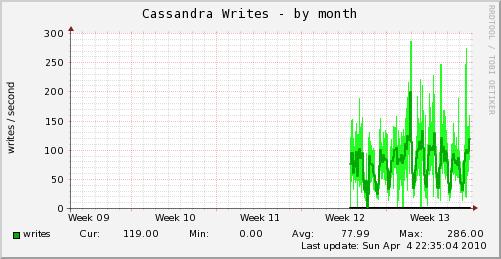
Has query performance dropped? Are you bottlenecked on disk, network, CPU, memory? Use the tools above to figure out your bottleneck. Did the number of queries to your cluster increase? Are you seeing longer than normal garbage collection times? Ops center has historical graphs that are useful here. Is there a single table affected, or every table? Use histograms and cfstats to dig into it.
-
Are nodes going up and down? Use a combination of ops center and your system metrics to figure out which node it is. If it's the same node, start investigating why. Is there a hot partition? Is it doing a lot of garbage collection? Is your application opening more connections than before? You should have system metrics that show these trends over time. Maybe you just have additional load on the system - it may be necessary to add new nodes. Don't forget to run cleanup.
This started out as a small recap but has evolved into much more than that. The tools above have helped me a wide variety of problems, not just Cassandra ones. If you follow the above recommendations you should be in a great spot to diagnose most problems that come your way.
You can find me on Twitter for any comments or suggestions.