Author: Jaqueline Caamal & Mike Uc
Apache Cassandra is the open sourced weapon of choice when looking for a very scalable and resilient database that, at the same time, is easy to master and simple to configure. Now, it is well known that many open source projects are weak on documentation, even when an upgrade is released. As unbelievable this sounds, Apache Cassandra isn’t an exception.
Apache Cassandra indeed has a long list of qualities that make it superior to other databases (rapid writing and super fast reading, fantastic fault tolerance, and extreme resilience, among others), and around 3K companies are happily using Cassandra in their production. But, what made those companies turning their heads to Cassandra? Probably the capability to store 1 million records per day and/or basically any of the problem solvers it offers.
As part of the engineering research, any potential Cassandra’s user creates an environment and test load for Cassandra that mimics their application workload. Then, at the implementation stage, will come up with one of the tools that make Apache Cassandra amazing: Cassandra’s stress tool.
So far, we realized there wasn’t any good tutorial on the internet about this topic. So, this article should be useful.
Normally, a stress test is used to determine the system’s robustness in terms of extreme load and helps to know if the system will perform sufficiently in case the current load behaves well above the expected maximum.
These are some use cases for Cassandra’s stress tool:
- Check the performance of your schema
- Improve your setting and data model
- Realize the scalability of your database
- Figure out your production capacity
First of all, you have to check the existence of Java in your system with the following command.
$ java-version
If it isn’t installed, download the latest from the following link: JDK
Step 1. Download Apache Cassandra
Add the following commands as shown below or download your Cassandra’s predilect version.
$ wget http://www.apache.org/dyn/closer.lua/cassandra/3.0.18/apache-cassandra-3.0.18-bin.tar.gz
Unzip the file with xzvf.
$ tar zxvf apache-cassandra-3.0.18-bin.tar.gz
Step 2. Start Apache Cassandra Server
Navigate into the directory you previously unpacked, and run the next command to start Cassandra Server.
$ cd apache-cassandra-3.0.18bin/apache-cassandra-3.0.18/
$ sudo ./bin/cassandra -f
If everything goes according to the plan, you’ll see the Apache Cassandra server starting. If you want to see the cluster status do it with this.
$ sudo ./bin/nodetool status
You would see something like this:
Step 3. How to use the tool
To use specific schemas with different compaction strategies, types and cache settings, you can use de YAMLS-based profiles. This tool shows us some sample files that are located in:
- Cassandra package installations: /usr/share/docs/cassandra/examples
- Cassandra tarball installations: install_location/tools/
This file can be used to design mixed workloads (read and write tests), but if you want to start without a YAML file, the Cassandra-stress tool creates automatically a keyspace (keyspace1) and tables(standart1). In this case, start with a manual write and read load. To do this, first you must know how to send the parameters by inserting this command line:
$ tools/bin/cassandra-stress help
Step 4. Write a sample test
If you want to manually prove the execution of the database with random values, set up the next:
- Write: Execute write operations. In this case, we inserted ten million rows with 200 threads.
- n: Number of operations to execute.
Let’s walk through what Cassandra’s stress tool does when you execute the next command:
$ tools/bin/cassandra-stress write n=10000000
- Cassandra’s stress tool creates a keyspace by executing this DDL:
2. Once the keyspace has been created, Cassandra-stress creates two tables: standard1 and counter1. In this test, we ignored counter1 since we didn’t use it. The definition of the standard1 table is the following:
As we can see, there is no clustering key, so is going to be 1 row per partition. The compression is disabled and the compact storage is enabled.
Another parameter that runs by default is the warm up. This is a normal procedure in this kind of testing: it reduces the variation from startup. For example, when the code is being loaded to memory. Warm up operations and test operations are almost the same, excluding the fact that one isn’t timed (but this is a whole new topic for another time, guys).
If you return to the command you’ll see that Cassandra-stress creates 200 threads by default capable of performing one right after another, until the target number of operations (10,000,000 writes) is inserted. If you want to control the load of the cluster, there is a -rate command to handle the number of threads.
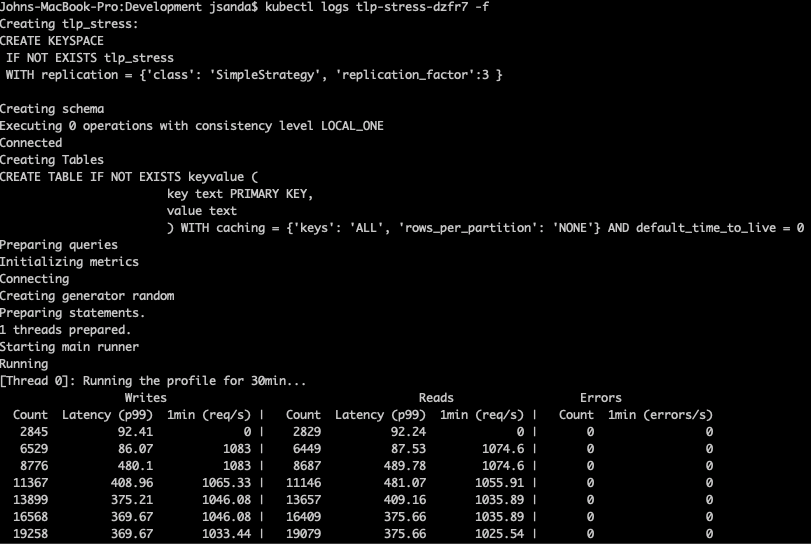
Step 5. The results
Finally, Cassandra-stress prints a summary with the results.
In this test, we generated and inserted one million values in over 3 minutes, which represents a rate of 431194 writes per second. We can see that the median latency per operation is 4.6 milliseconds, despite the fact that a small number of writes took longer.
The complete explanation of each result can be found here.
If you want to read some values too, you can use the next command, and the execution will be a little bit different.
$ tools/bin/cassandra-stress read n=10000000
Sleeping 2s....
Warming up READ with 10000000
Running with 4 threadCount
Running READ with 4 threads for 10 000 000 iteration
What happens now? The number of threads starts with a small number and increases.
The Cassandra-stress tool regularly prints the statistics from the last several writes, preceding the output from the last block of statistics.
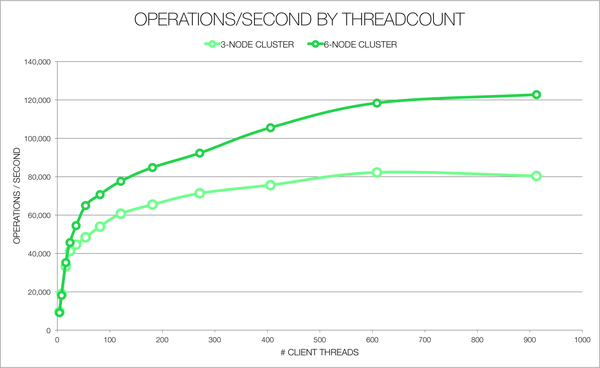
This is a phenomenal tool to do benchmarks, to improve your system performance or to get indicators on what you expect from your cluster. Another thing that I like about this tool is that it gives us a graph parameter to see the performance, depending on what we want to put to test.
At this point, we’ve shown how to run basic stress scenarios in Cassandra’s stress tool. But, what happens if you want to run your own schema? Well, second parts are not always a bad idea. So, you’ll have to read our second part on how to use Cassandra’s more advanced stress scenarios using YAML files, a kind of test recommended to save time, above all.