Tuning the Java Virtual Machine (JVM) can improve performance or reduce high memory consumption.
Tuning the Java Virtual Machine (JVM) can improve performance or reduce high memory consumption.
- About garbage collection
- Choosing a Java garbage collector
- Setting CMS as the Java garbage collector
- Determining the heap size
- How DataStax Enterprise uses memory - Read first for a better understanding of the settings and recommendations on this page.
- Adjusting JVM parameters for other DataStax Enterprise services
- Other JMX options
Choosing a Java garbage collector
- Heap sizes from 16 GB to 64 GB.
G1 performs better than CMS (concurrent-mark-sweep) for larger heaps because it scans the regions of the heap containing the most garbage objects first, and compacts the heap on-the-go, while CMS stops the application when performing garbage collection.
- The workload is variable, that is, the cluster is performing the different processes all the time.
- For future proofing, as CMS will be deprecated in Java 9.
- G1 is easier to configure.
- G1 is self tuning.
- You only need to set MAX_HEAP_SIZE.
- You have the time and expertise to manually tune and test garbage collection.
Be aware that allocating more memory to the heap can result in diminishing performance as the garbage collection facility increases the amount of database metadata in heap memory.
- Heap sizes are smaller than 16 GB.
- The workload is fixed, that is, the cluster performs the same processes all the time.
- The environment requires the lowest latency possible.
Note: For help configuring CMS, contact the DataStax Services team.
Setting CMS as the Java garbage collector
- Open .
- Comment out all lines in the
### GI Settingssection. - Uncomment all the
### CMS Settingssection
Determining the heap size
max(min(1/2 ram, 1024 megabytes), min(1/4 ram, 32765 megabytes))
- Heap size is usually between ¼ and ½ of system memory.
- Do not devote all memory to heap because it is also used for offheap cache and file system cache.
- Always enable GC logging when adjusting GC.
- Adjust settings gradually and test each incremental change.
- Enable parallel processing for GC, particularly when using DSE Search.
- The GCInspector class logs information about any garbage collection that takes longer than 200 ms. Garbage collections that occur frequently and take a moderate length of time (seconds) to complete, indicate excessive garbage collection pressure on the JVM. In addition to adjusting the garbage collection options, other remedies include adding nodes, and lowering cache sizes.
- For a node using G1, DataStax recommends a MAX_HEAP_SIZE as large as possible, up to 64 GB.
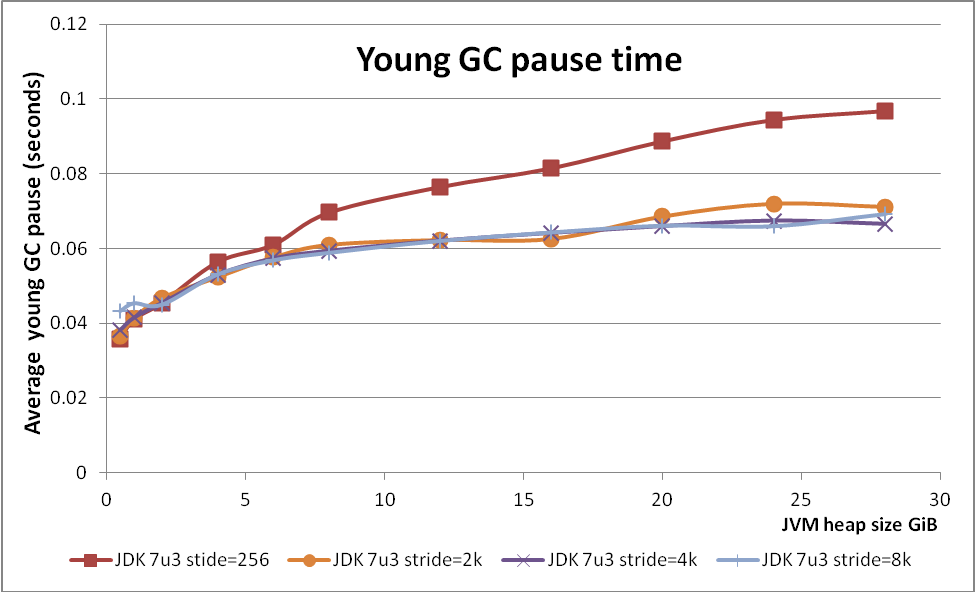
Note: For more tuning tips, see Secret HotSpot option improving GC pauses on large heaps.
MAX_HEAP_SIZE
- Set the maximum heap size in the file to
a high arbitrary value on a single node. For example, when using
G1:
-Xms48G
-Xmx48G
Set the min (-Xms) and max (-Xmx) heap sizes to the same value to avoid stop-the-world GC pauses during resize, and to lock the heap in memory on startup which prevents any of it from being swapped out.
- Enable GC logging.
- Check the logs to view the heap used by that node and use that value for setting the heap size in the cluster:
Note: This method decreases performance for the test node, but generally does not significantly reduce cluster performance.
If you don't see improved performance, contact the DataStax Services team for additional help.
HEAP_NEWSIZE
- 100 times the number of cores
- ¼ of MAX_HEAP_SIZE
-Xmn800M
A larger HEAP_NEWSIZE leads to longer GC pause times. For a smaller HEAP_NEWSIZE, GC pauses are shorter but usually more expensive.
SeeRecommended minimum memory for dedicated hardware and virtual environments.How DataStax Enterprise uses memory
- To perform reads, the database maintains the following components in heap memory:
- Bloom filters
- Partition summary
- Partition key cache
- Compression offsets
- SSTable index summary
This metadata resides in memory and is proportional to total data. Some of the components grow proportionally to the size of total memory.
- The database gathers replicas for a read or for anti-entropy repair and compares the replicas in heap memory.
- Data written to the database is first stored in memtables in heap memory. Memtables are flushed to SSTables on disk.
- Page cache. The database uses additional memory as page cache when reading files on disk.
- The Bloom filter and compression offset maps reside off-heap.
- The database can store cached rows in native memory, outside the Java heap. This reduces JVM heap requirements, which helps keep the heap size in the sweet spot for JVM garbage collection performance.
Adjusting JVM parameters for other DataStax Enterprise services
- DSE Search: Some users have reported that increasing the stack size improves
performance under Tomcat. To increase the stack size, uncomment and modify the default setting in thefile.
# Per-thread stack size.
JVM_OPTS="$JVM_OPTS -Xss256k"
Also, decreasing the memtable space to make room for search caches can improve performance. Modify the memtable space by changing thememtable_heap_space_in_mbandmemtable_offheap_space_in_mbproperties in thefile. -
MapReduce: Because MapReduce runs outside the JVM, changes to the JVM do not affect Analytics/Hadoop operations directly.
Other JMX options
DataStax Enterprise exposes other statistics and management operations via Java Management Extensions (JMX). JConsole, the nodetool are JMX-compliant management tools.
Configure the database for JMX management by editing these properties in .
- com.sun.management.jmxremote.port: sets the port on which the database listens from JMX connections.
- com.sun.management.jmxremote.ssl: enables or disables SSL for JMX.
- com.sun.management.jmxremote.authenticate: enables or disables remote authentication for JMX.
- -Djava.rmi.server.hostname: sets the interface hostname or IP that JMX should use to connect. Uncomment and set if you are having trouble connecting.
Note: By default, you can interact with DataStax Enterprise using JMX on port 7199 without authentication.