Accenture had the opportunity to stand-up such a streaming analytics platform that delivers insights in near-real time meaning that the time from when sensor data arrives in the system until when insight is delivered happens in the order of seconds.
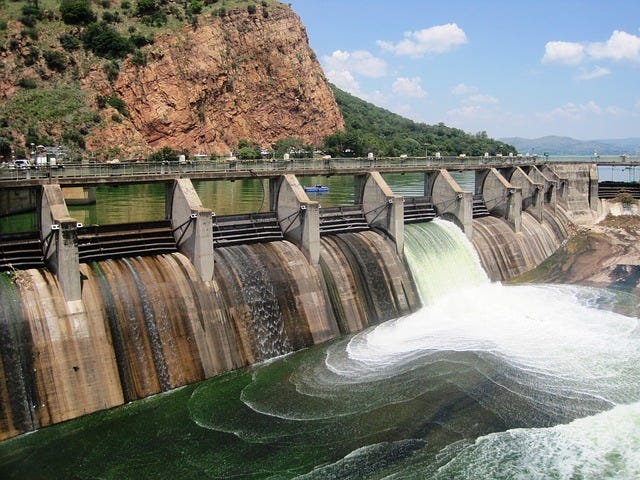
Recently, we were asked to help a client manage their water distribution network that had hundreds of thousands of tagged sensors – measuring for example, water flow and pressure. This client had already embraced analytics for reporting and capacity planning supported by a batch architecture that easily met daily turn-around times to analyze all the data. From the time sensor readings were ingested, the existing batch architecture could deliver insights into the capacity and health of their water network within 15 minutes.

The client was interested in adding real-time views onto the health and events along their water network to improve operational efficiency that ultimately improves customer satisfaction. The objective was to present dynamic views of the current state of the water network refreshed on the order of seconds.

To begin with, we focused on the detection and prediction of leakage events. Their existing batch architecture was too slow; even a turnaround in minutes wastes precious moments before remediation efforts can begin. Real-time monitoring combined with predictive algorithms manages operational pressure to proactively reduce high and low pressure spikes that serve as a primary cause of leaks. These improvements result in avoiding leaks, prolonging the longevity of assets, and reducing disruption to customers.
For streaming analytics, the challenge lies in handling at speed the large number of parallel computations kicked-off by arriving sensor data. Each time a sensor reading takes part in a number of online algorithms that need to be computed on the order of seconds. We provide a sample of these algorithms implemented to give some insight into the complexity that the solution handles at real-time.
First, arriving sensor data is not periodic and is assumed to be unreliable. Different streams of sensor data come in at different time ticks (or intervals of time) be it on the order of days, minutes, or seconds. Before computations and visualizations occur, we first need processing to normalize streamed data across different sources according to common time ticks (e.g., every 5 seconds or 1 minute). In the event of missed sensor readings, calculations estimate the values for the missed value to allow for operations to progress, but then require additional calculations for backfilling and reconciliation upon recovery of lost data (e.g., when network outage is restored or when a sensor comes back online).
To do prediction, an algorithm projects readings forward into time against a function. An online curve-fitting algorithm continuously trains the function based on the arriving streamed data.
Further analytics includes processing complex events like when a series of sensor readings that convey various high and low thresholds on critical pressure points. These indicate detection of a leakage event, which triggers follow-up actions.
In addition, we implemented more complex computations like those for estimating impact of the most recent usage and operations on reservoir supply that combine streamed data with historical data (e.g., over the past 7-days) fetched from the data store.
To handle these computations, we implemented a lambda architecture pattern based on that of many of today’s internet companies like Twitter, Facebook, and LinkedIn. In the same way that these internet companies balance real-time analytics on live social feeds against batch analytics over a vast quantity of historical user data, we do the same with balancing streaming and batch analytics on sensor data. To that end, we added a parallel data flow for streaming analytics to the existing batch flow.
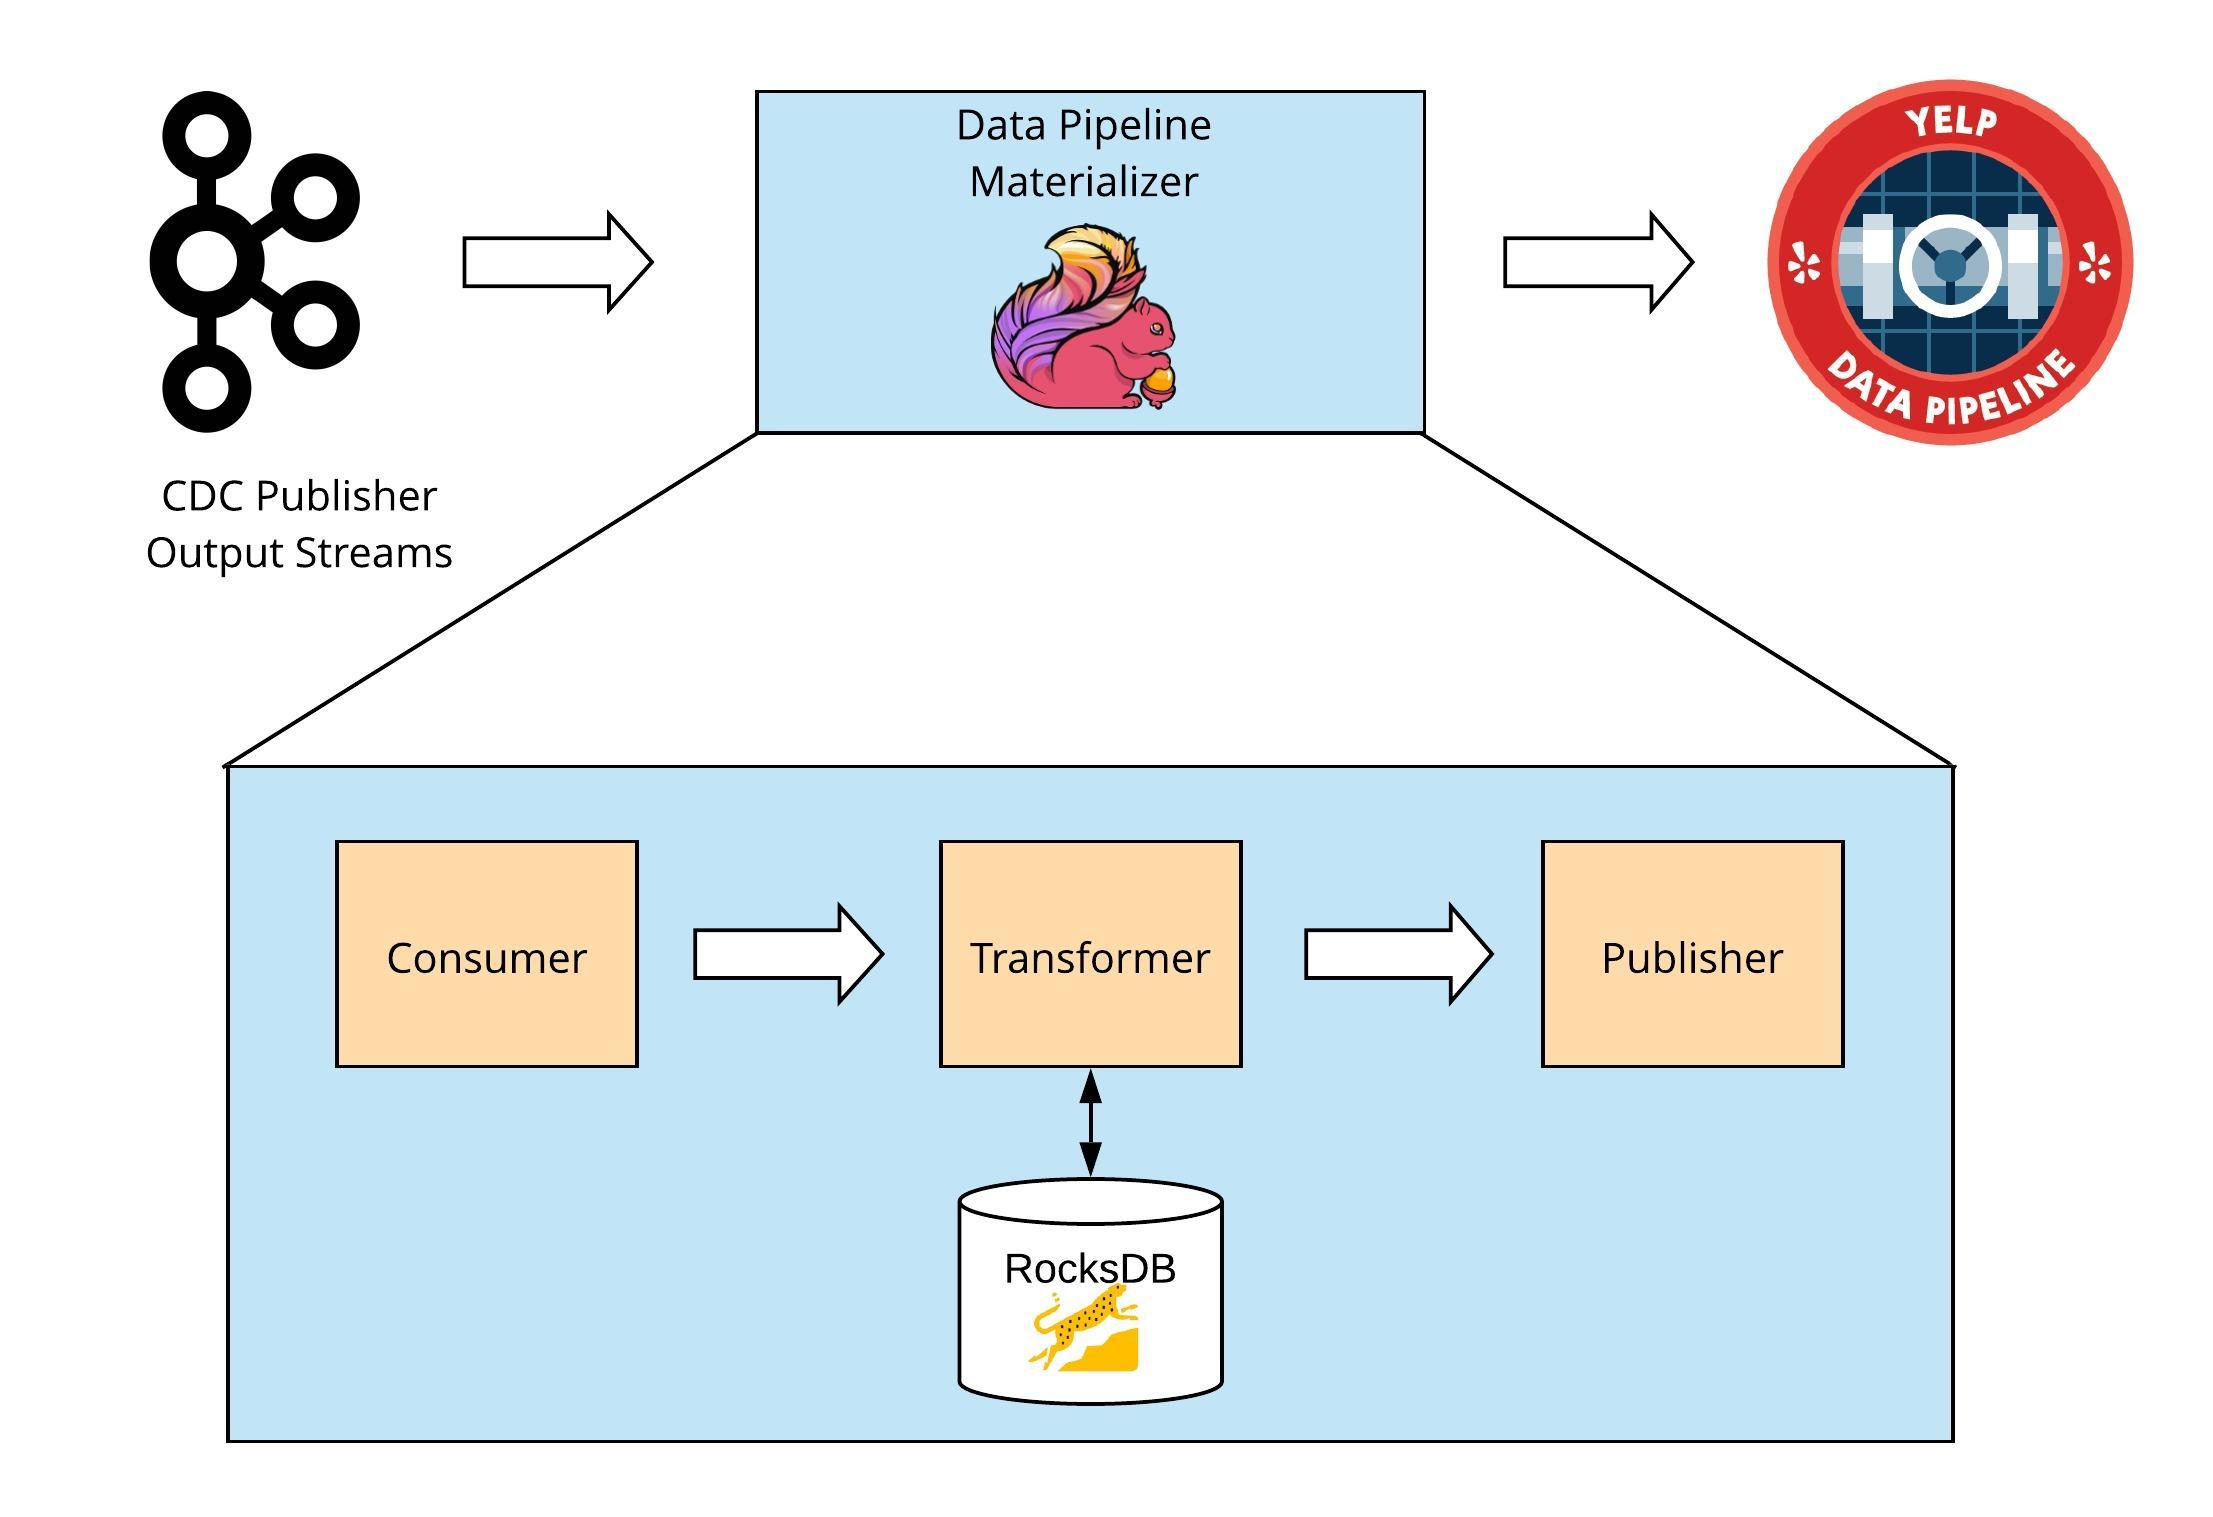
To start, we created data publishers for pushing data from the client’s sensor network into our platform. For this client, it meant getting data from their OSI Pi historian that serves as a gateway for a majority of the sensor data and for REST APIs. We ingested this data into a stream processor Amazon Web Services’ (AWS) Kinesis. Apache Spark Streaming runs computations for real-time detection and analytics, and AWS Dynamo and stores the time-series data and results of our processing. A Java API tier obfuscates data store interfaces for querying the results that are then visualized in a dashboard built using D3.
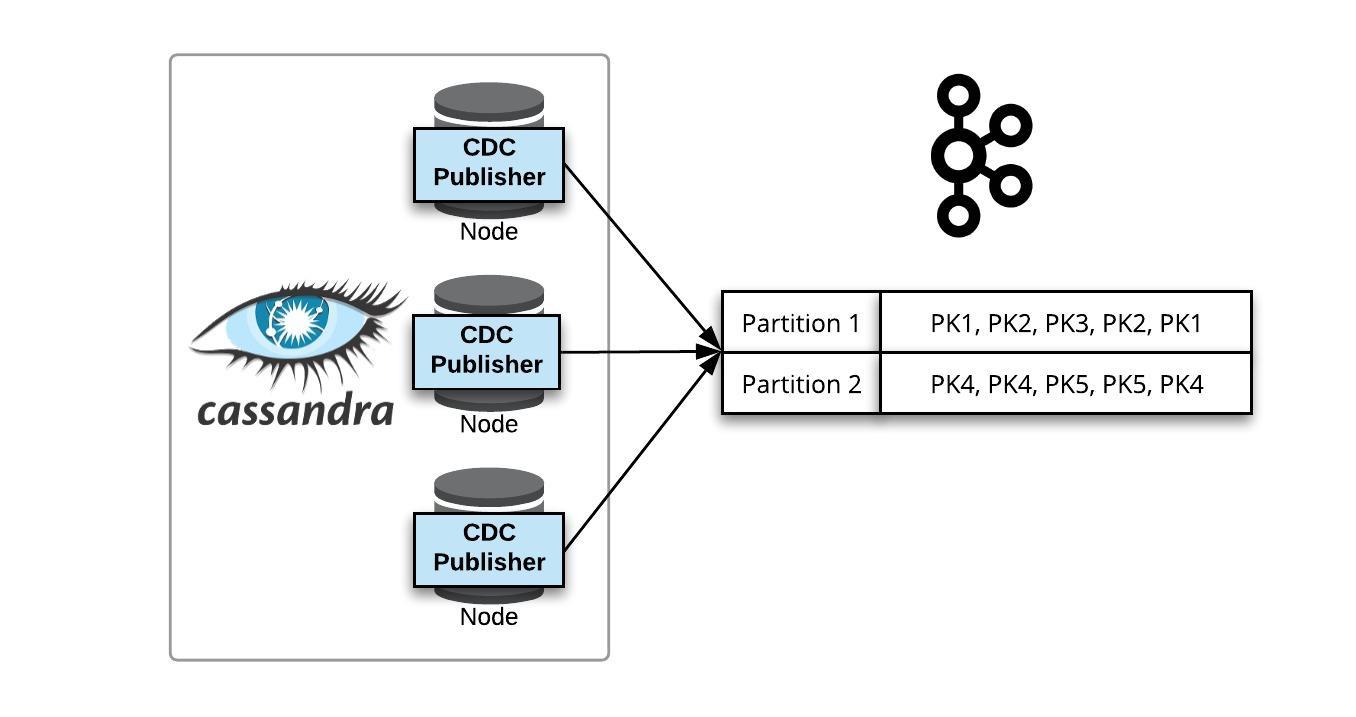
Over the course of six weeks, the team created the reference implementation for the water network. For the initial build-out we leveraged as-a-Service Amazon Web Services components that were ready as-a-Service for agility sake. The team then hardened this architecture, re-platformed onto Apache Cassandra and Kafka to allow for an on-premise option in addition to our AWS cloud-based implementation, load tested it with ingestion data at over 3000 events per second, and packaged its components for reuse.
The result is an architecture proven for leakage detection in water networks, but is now prebuilt and ready to onboard new streaming analytics applications and domains.
The next opportunity can reuse the same architecture and even the same sensor health algorithms (e.g., for dealing with unreliable sensor data) accelerating the time to standup a solution by allowing the project to focus on onboarding the domain specific algorithms.
Posted by Teresa Tung, Ph.D. Accenture Technology Labs' Next Generation Software Architecture R&D group