# actually sets for docker container as well
sudo sysctl -w vm.max_map_count=262144
docker-compose up
See here for more info on how it works.
Test that it is working
Add a dummy log (see instructions here)
# start logstash cli session in docker container
sudo docker exec -it elk /opt/logstash/bin/logstash --path.data /tmp/logstash/data \
    -e 'input { stdin { } } output { elasticsearch { hosts => ["localhost"] } }'
Wait for something like The stdin plugin is now waiting for input:. Then add some logs. Whatever you type becomes a log in logstash.
demo log entry
Check that it shows up in ES by hitting http://localhost:9200/logstash-*/_search?pretty&size=1000. It should show up somewhere in one of the entries. (This will get records from indices that start with logstash-*).
Setup Filebeat
Processing (ie parsing) Cassandra logs
Since filebeat doesn't have a Cassandra DB module currently, we have to add our own filebeat processor to filter and enhance the logs.
For this demonstration we are going to largely borrow from Anant's NodeAnalyzer tool. They have a sample filebeat config that provides processor settings.
We also made use of The Last Pickle's filebeat.yml from their docker Cassandra bootstrap project.
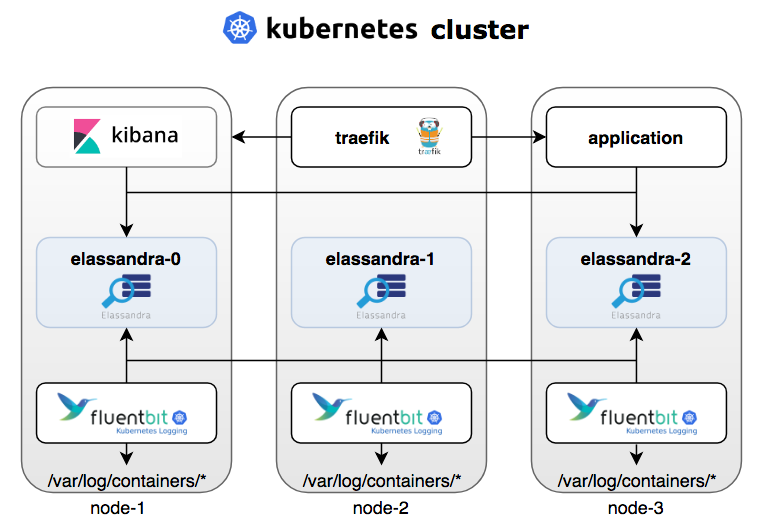
Container directory organization
elk container
- logstash configs (e.g., beats-input.conf):
/etc/logstash/conf.d - logstash binaries: /opt/logstash/bin/
filebeat container
filebeat.yml:/usr/share/filebeat/filebeat.yml
Note that the filebeat host and port have to be set on both the filebeat.yml in the filebeat container as well as in the logstash conf beats-input.conf file in the elk container, or else will get:
- Port where logstash is listening for beats input is set in
beats-input.conf - Port where beats is sending it to is set in filebeat.yml
Failed to connect to backoff(async(tcp://filebeat:5044)): dial tcp 172.23.0.3:5044: connect: connection refused
This will appear in filebeat logs.
Instructions/References
- Following these instructions might be helpful. But using the official ES filebeat image for now.
- Could do a volume based config system, but we want to be consistent across envs without any additional setup, so do it within docker
Sample Scripts
Make sure filebeat is connecting to ES
To make sure it worked, try: http://localhost:9200/_cat/indices. You should see one like filebeat-2020.08.04. Check it out by doing: http://localhost:9200/filebeat-*/_search?pretty&size=1000
Throw it some C* logs from host
docker cp /var/log/cassandra/ filebeat:/var/log/cassandra/
Change the config and restart
Easiest right now is just to rebuild
docker-compose up --build -d
Then will need to throw it some logs again, since everything else was reset. See that docker cp script above for how
NOTE: Can't just copy in a new yml, since it won't have the right permissions
This WON'T work, since need to change permissions (see the Dockerfile.filebeat example of what needs to be ran for the proper permissions to be set on the filebeat.yml file)
docker cp configs/filebeat.yml filebeat:/usr/share/filebeat/filebeat.yml
docker restart filebeat
Setup Kibana Dashboards for filebeat
https://www.elastic.co/guide/en/beats/filebeat/current/load-kibana-dashboards.html
docker exec filebeat filebeat setup --dashboards
It will take a few minutes, showing just Loading dashboards (Kibana must be running and reachable).
This is a CLI way of setting up dashboards, rather than just setting them up from the config using setup.dashboards.enabled: true or using other settings as described here.
Should now be able to view Kibana filebeat dashboards in the Discover view (following these instructions. If you don't see any, make sure that the time filters are set around the time frame the logs were added into filebeat NOT when the log event happened.
Sample Queries/Filters in Kibana for Cassandra
Get ERROR level logs for the past 90 days
Filters using lucene query: ingest.loglevel:ERROR
Save progress (export kibana data to version control)
./scripts/export-kibana-dashboards.sh
TODO make an import script using this
Copyright (c) 2020 Ryan Quey.
Permission is hereby granted, free of charge, to any person obtaining a copy of this software and associated documentation files (the "Software"), to deal in the Software without restriction, including without limitation the rights to use, copy, modify, merge, publish, distribute, sublicense, and/or sell copies of the Software, and to permit persons to whom the Software is furnished to do so, subject to the following conditions:
The above copyright notice and this permission notice shall be included in all copies or substantial portions of the Software.
THE SOFTWARE IS PROVIDED "AS IS", WITHOUT WARRANTY OF ANY KIND, EXPRESS OR IMPLIED, INCLUDING BUT NOT LIMITED TO THE WARRANTIES OF MERCHANTABILITY, FITNESS FOR A PARTICULAR PURPOSE AND NONINFRINGEMENT. IN NO EVENT SHALL THE AUTHORS OR COPYRIGHT HOLDERS BE LIABLE FOR ANY CLAIM, DAMAGES OR OTHER LIABILITY, WHETHER IN AN ACTION OF CONTRACT, TORT OR OTHERWISE, ARISING FROM, OUT OF OR IN CONNECTION WITH THE SOFTWARE OR THE USE OR OTHER DEALINGS IN THE SOFTWARE.