Over the past year or so, I’ve met a handful of software companies to discuss dealing with the data that pours out of their software (typically in the form of logs and metrics). In these discussions, I often hear frustration with having to get by with a set of fragmented tools patched together over time. There’s usually a number of independent tools, such as:
- A tool for ops monitoring and alerting.
- Something for devs to track performance and do troubleshooting.
- An entirely separate system for business intelligence (BI) and the business to see what users are doing in the system.
And while these tools use different lenses and come from different angles, they’re looking at the same sources and types of data. As a result, many software teams say, “given some time, we can build something better.” And frankly, given the amazing set of open source building blocks out there, it makes sense to ask the question of whether you can’t just roll your own. At Jut we did just that. We built a streaming analytics system on top of open source, big data components, and this post lays out the blueprint for the pieces we used and how we put them together. We’ll cover:
- Ingest: how to bring in many different types of data streams.
- Index and querying: efficient storage and unified queries.
- Wiring it up: how data flows through the system.
- Optimization: make the whole thing fast, so people will actually use it.
I hope reading this will help you architect your system in a sane, scalable way and avoid some of the pitfalls we encountered.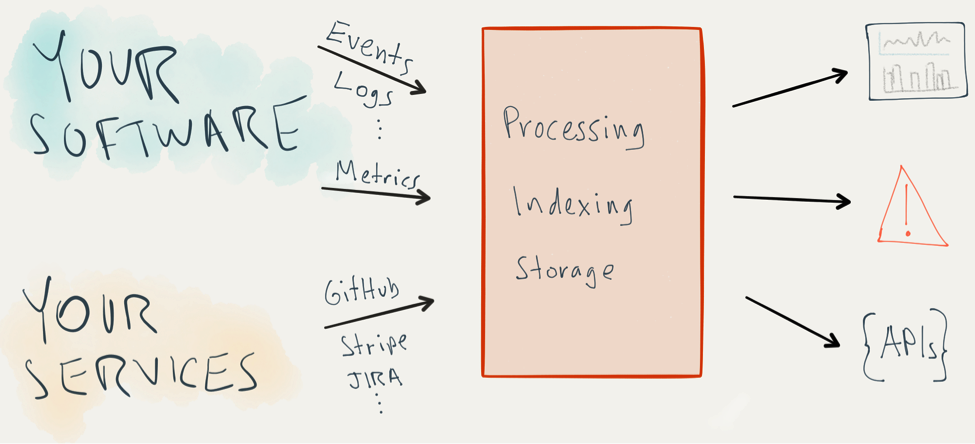
Ingesting Data
When it comes to operational analytics and monitoring, there’s no shortage of relevant data types, formats and transport protocols. You’ll need to be able to point all sorts of disparate sources and senders at this system you’re building. For example, your data might include any of the following:
- Custom application events.
- Container-level metrics and logs.
- Statsd or collectd metrics.
- Webhook events from third parties, like GitHub or Stripe.
- Application or server logs.
- User activity.
While these all have different formats and representations, they need a uniform representation inside the system. And whichever representation you choose, you’ll need to translate incoming streams of data into it.
The representation we ended up with is simple and flexible: each record (“point”) is a set of key/value pairs, which can be conveniently represented as a JSON object. All points have a “time” field and metric points also have a numeric “value” field; other points can have any “shape.” A frontend HTTPS server (running NGINX) receives incoming data, which is de-multiplexed and sent on to local, per data-type “connector” processes (running Node.js). These processes translate the incoming data into the system’s internal representation, then publish them into a Kafka topic (for reliability), from which they can later be fetched for indexing and/or processing.
In addition to the data types above, consider any connectors that will make it easiest for your own team to integrate into your data hub. You may not need quite as much generality or flexibility as I describe here, but design some flexibility into your ingest — the more data types you accept, the less you’ll need to buy or build some other silo when new data comes along.
Indexing and Storing Data
All this data needs to sit somewhere. Preferably in a database that will easily scale as your data needs grow. And the more analytics-like querying that database supports, the better. If this data hub was only for logs and events, then you could just choose ElasticSearch and be done. And if this were only about metrics, you could just pick a time-series database (TSDB). But we need to handle them all. We ended up building a system that had multiple native data stores so that we could most efficiently handle different types of data.
Logs and Events go in ElasticSearch
We use ElasticSearch as our events database. These events can have varying “shapes,” depending on which source they come from. We use a number of ElasticSearch APIs to great effect, notably the Query and Aggregations APIs.
Metrics go in Cassandra and ElasticSearch
While metrics could, in principle, be entirely stored in ElasticSearch (or any other database), it is far more efficient to use a specialized database with a data model that matches the inherent structure and redundancy of metrics data.
The obvious approach would be to take an existing open source time series database (TSDB). That’s what we did initially — we used an open source TSDB that used Cassandra as its backend. The challenge in this approach is that the TSDB has its own query API, which is different from ElasticSearch’s. And with this underlying disparity, presenting a uniform search and query interface across events and metrics is hard.
This is why we ended up deciding to write our own TSDB that stores metrics across both Cassandra and ElasticSearch. Specifically, we store the time/value pairs in Cassandra and the meta-data in ElasticSearch, and we have a query and management layer on top. This way, searching and querying for events and metrics can be done uniformly inside ElasticSearch.
The Stream Processing Engine
So now we have an ingest pathway and some databases. Are we ready to tack on a frontend app and play with our data? Not yet! Even though ElasticSearch can do some log and events analytics natively, we still need a processing engine. Because:
- We want one unified way to access events and metrics, for realtime or historical data.
- For certain use cases (monitoring, alerting) we need to be able to process live data in real time, as it comes in.
- Metrics! We want to do more then just search for metrics and read them out — metrics are there so that we can crunch them.
- Even for events, we need a more general processing capability than the one provided by the ElasticSearch APIs. For example, to join data from different sources, or do string parsing, or custom aggregations.
This is the point where things start to get really interesting. You could spend days (or more) studying up on how others have built data pipelines, learn about Lambda, Kappa and other exotic-sounding data architectures. There’s actually a lot of really good material out there. We’ll cut to the chase and throw our hat in the ring: we think the way to go is a unified processing engine that’s used for both live streaming and batch computation. In that regard, we’ve always fully espoused the ideas that are nicely articulated here and here.
Flow graph
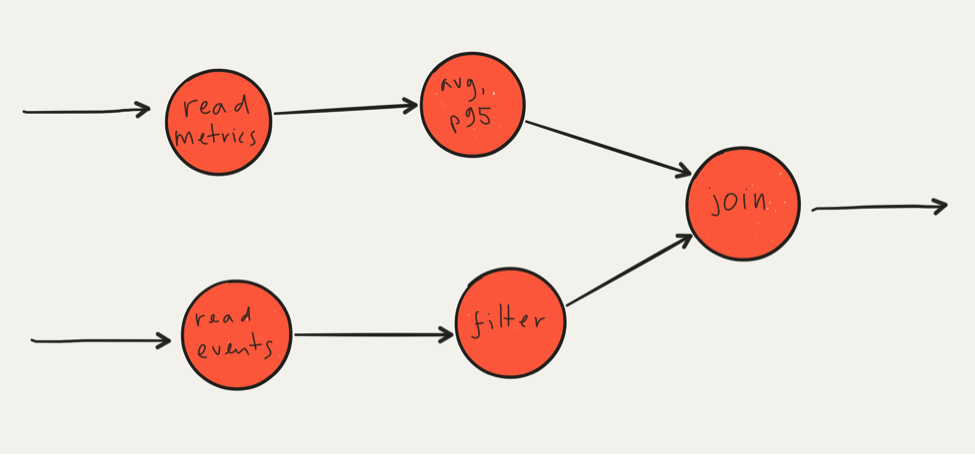
Here, unlike for storage and ingest, we built the processing engine from the ground up — not because there aren’t other stream processing engines out there, but because of our focus on querying and performance, which we’ll discuss in separate sections below. More specifically, we built a stream processing engine that implements a dataflow processing model, where computation is represented as a directed graph of operators that transform inputs into outputs by applying operators such as transforms, aggregations, windowing, filtering or joins. It is a natural way to model queries and computations in a way that is composable, suited to both live and batch, and maps directly to a distributed runtime.
Of course, unless you’re really looking for a big new project to take on, you’ll probably want to use an open source streaming engine. We’d recommend taking a look at Riemann, Spark Streaming or Apache Flink.
Expressing Queries and Computation
We’re using a stream processing engine that’s based on a dataflow model of computation. But how does a user express queries and create such dataflow graphs? One approach is to provide an API or embedded DSL. That API will need to provide ways to query and filter data, define transforms and other processing operations, and most of all, provide a way to assemble individual processing stages into flow graphs. Each of the projects mentioned above have their own APIs, and while individual preferences may vary, one common challenge of APIs is that APIs aren’t accessible to non-developers like SQL analysts or Excel users.
One likely course of action, at this point, is to declare that those users will have interact with the system via tools (for example, a simple web app) that are written to these APIs.
Another approach is to provide a simple query language. This is what we did at Jut. Because there’s no established query language for dataflow (like there’s SQL for relational queries), we created a dataflow query language called Juttle. At its core, Juttle consists of flow graph language with simple syntax to declare processing pipelines like the one above. It has such primitives as search, windowing, join, aggregations and group-by, with simple syntax for using them. Of course, before processing data in a flow graph, you need to fetch it — Juttle allows you to define queries that fetch data from any combination of events and/or metrics, live and/or historical, all with the same syntax and constructs. Here’s a simple example that follows a pattern of …
query | analyze | view
(Note the familiar shell-like syntax for chaining using a pipe operator).
read -from :1 day ago: data_type = 'web_log'

| reduce -every :minute: count() by status_code

| @timechart
Putting the Pieces Together: An Example With Anomaly Detection
So far we’ve taken a component-centric lens — we’ve discussed building blocks and their role, but without saying much about how they fit together. Now we’re going to switch to a data-centric lens, to see what pathways need to be setup to support live and historical queries. Let’s use the example of running an anomaly detection algorithm. It’s a good example because we need to query historical data to train the underlying statistical model, live streaming data to test for anomalies, and then we need to write back results to the system while alerting on anomalies.
But before we do any sort of querying, we need to wire up the ingest path way so that incoming data is written to indexed storage. This is done by the import service, which amongst other things implements the write path of time series database, splitting metrics data and meta-data across ElasticSearch and Cassandra.

Indexing incoming data.
Now a user comes along and launches an anomaly detection job. This requires reading historical data, which the processing engine does by querying the underlying databases directly. Depending on the query and data this may include optimization (discussed below), and/or implementing the read path of the metrics database (issuing metadata queries to ElasticSearch, pulling the metric values out of Cassandra, and combining the results to produce the actual metric points).

Historical, live and write-back flows with an anomaly detection query.
The historical data covers some past range up to “now.” After that data has been streamed into the flow graph, the processing engine switches this flow graph to live — reading data as it arrives into the system and streaming it into the flow graph. In order to do this, the processing engine taps directly into the incoming stream of points from the import service. Note that this cut-over must be done carefully to avoid dropping or duplicating points.
At this point we have a trained anomaly-detection flow graph running over live data. When an anomaly is detected, we want it to send an alert to some external system, which is done by having the processing engine POST to some external HTTP service. In addition to sending out this alert, we’ll also want to keep track of it inside the system. In other words we want the ability to write back data streams into the system. Conceptually this is done by having the processing engine pipe back data into the ingest pathway.
Making it Fast
So we have a working system with an ingest pathway and some databases and a processing engine. Are we ready to tack on a frontend app and play with our data? Still not!
Well, we actually could do that right now, but the problem is we’ll have really slow query performance for historical queries. And slow queries means … no one will use this.
So let’s revisit the notion of a “unified processing engine” for a second. We explained that it is the same system doing both historical and live processing with the same constructs, abstractions and queries.
The performance challenge comes from the fact that there’s far more historical data than live data. For example, assume we have one million points/sec coming into the system, and a processing path that is fast enough to run a live query on these points as they come in. Now take the same query and run it over the past day’s worth of data — it will need to process tens of billions of points all at once (or, at least, as fast as they can be read from storage). Assuming the computation is distributable, we could address this by adding on compute nodes, but in the best case, this would be inefficient and costly.
So this is where optimization comes in. There are many ways to optimize dataflow queries. Some of them consist of transforming the query itself — for example, moving filters or aggregations upstream where possible without changing query semantics. The one we’ll talk about here is a form of pushdown optimization , which pushes filtering and processing down into the databases wherever possible. This requires doing the following:
- Automatically recognizing which parts of a query can be pushed down into the database.
- Taking those parts and translating them into the query language of the target database.
- Running the backend query and injecting the results at the right point in the dataflow graph.
Wrap Up
We’re done! Well, we’re done if we’re willing to do without a visualization layer, and only query the system via an API. But building a client app to create queries, stream and visualize data, and compose dashboards is a whole other can of worms, so we’ll leave it for another day.
For now, let’s just summarize what we’ve seen on the way to building this data hub:
- An ingest pathway that accepts incoming data from heterogenous sources, and translates it to a uniform representation, and stores it for later consumption. (In the case of Jut, this is built on top of Kafka).
- Databases for events and metrics. For Jut we use ElasticSearch for events and have built a custom metrics database on top of Cassandra.
- A processing engine (or two, if you’re going with a lambda-ish architecture).
- An API or query language to run queries on the system.
Phew. If you’ve gotten this far, congratulations. It’s a long, but fun, journey. And either way, even if you’re building your own, check out Jut. You might just be inspired.
Feature image: “linked data” by Elco van Staveren is licensed under CC BY-SA 2.0.