Integrating Zipkin tracing into Cassandra, it’s possible to create one tracing view across an entire platform. The article is a write-up of the Distributed Tracing from Application to Database presentation at Cassandra Summit 2015, Santa Clara.
This article covers the need for distributed tracing in our modern development environment, and looks at using Zipkin as a way to achieve that. Zipkin is a solution from Twitter, specialised for distributed tracing. In addition, this write up looks into replacing Cassandra’s internal tracing with Zipkin to present full-stack tracing where we have one tracing view across the entire system.
The need for distributed tracing
We’re constantly seeing the need to scale data. It has been formalised with big data’s three V’s: volume velocity and variety; and now we’re seeing it implemented with technologies like Cassandra, Kafka, and Spark. Amongst these technologies it is Cassandra that gives us the data platform. But with all these technologies we’ve been brought forth into this new age of BASE and lambda architectures, invalidating the outdated technologies like Oracle.
And it isn’t just about scaling data – often solutions that need to scale data due to their success also face the more difficult problem of having to scale programmers and teams. We see this reality in how Microservices, which is really just a fresh revival of Service-orientated Architectures, and DevOps deals with how to create positive cohesive cultures in our companies where teams are decentralised and autonomous, taking advantage of Conway’s Law rather than fighting against it.
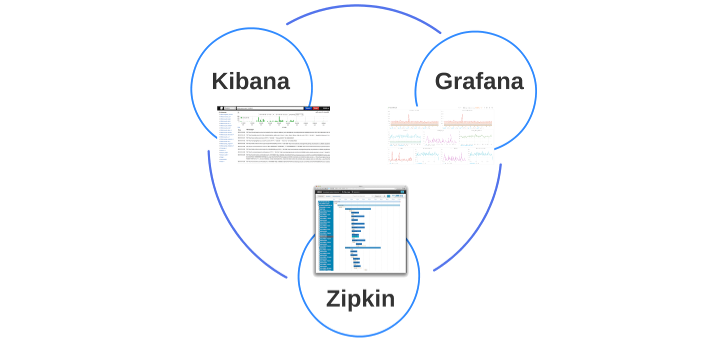
So with a combined need to scale both data and people, we’re seeing how important it is that companies have modern monitoring tools in place. Two of these tools Kibana and Grafana are becoming more popular and their usefulness is quickly becoming self-evident. Adding to this there’s a need for a third tool to complement the aggregation of logs and metrics. This third tool is to tackle the problem of distributed tracing.
Zipkin is the tool that solves the distributed tracing problem. It helps you fix high 99th percentile latencies by quickly identifying the culprits for platform latencies, provides a correlation ID useful to connect logs together, helps visualise hierarchy and asynchronicity of calls, and gives a greater level of transparency into your platform for the whole company.
Bringing these three tools together is crucial in making distributed decentralised teams fully capable of solving the “architectural safety” challenges of microservices. With the correct development methodologies and supporting DevOps tools, teams quickly find themselves in a high quality ‘stable master’ development cadence where production exceptions are rare and short-lived occurrences. The core infrastructure code doesn’t fester and expand with half-thought through bug fixes from a culture of someone-elses-problem and inadequate tools to fully see into the faults. Instead a product is built where no user is left out. A positive cohesive culture is established where teams deploying new features and improvements become aware of bugs and collateral damage they cause to other teams, well before those teams see the problems themselves. Such a level of quality assurance implicit within development practices of continuous delivery in turn makes other aspects of incremental development easier, like dark launching where whole microservice implementations can seamlessly be switched out without any platform coordination.
The cultural benefits of having these modern DevOp tools in place is interesting as it’s not just about building more positive collaborative relationships between teams but building a more productive and responsible relationship between teams and middle management. Microservices is about decentralising teams and giving them autonomy, and the role of Architects and middle management changes once these things are in place and functional, as they become more facilitators and communicators.
From my own experience, tackling the cultural challenges in a company is not only the most important work but almost always the hardest. When solutions to such challenges manifest in hacks as simple as putting in place the new tools that change people’s behaviour without them realising, it’s really nothing to scoff at. Knowing in advance which tools create such positive cultural shifts is basically impossible to foretell, but I’ve seen it with Git and its practice of pull requests and stable master branches, and I’ve seen it with Grafana, Kibana, and Zipkin.
Zipkin
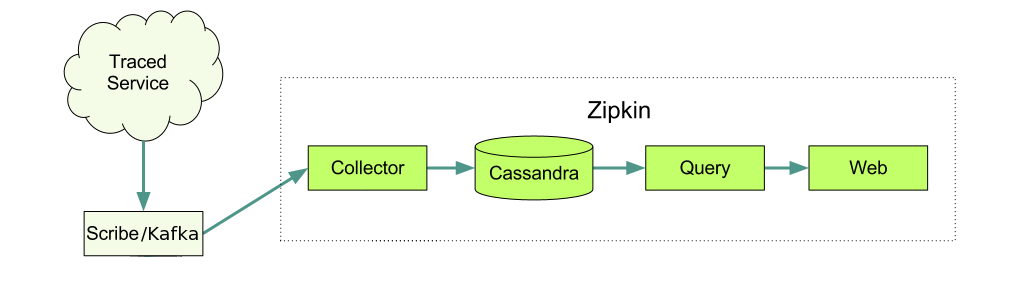
Zipkin is an implementation of Google’s Dapper paper from 2010. Google took a relatively simple approach by instrumenting running applications to send simple messages or annotations marking when a call to another service has been made and received. By having a separate service responsible solely for collecting these instrumentation messages, the problem of distributed tracing could be solved. The paper does say that the hardest part of distributing tracing is not the supporting software but the instrumentation that’s required across all the codebases in the platform.
Zipkin Web UI
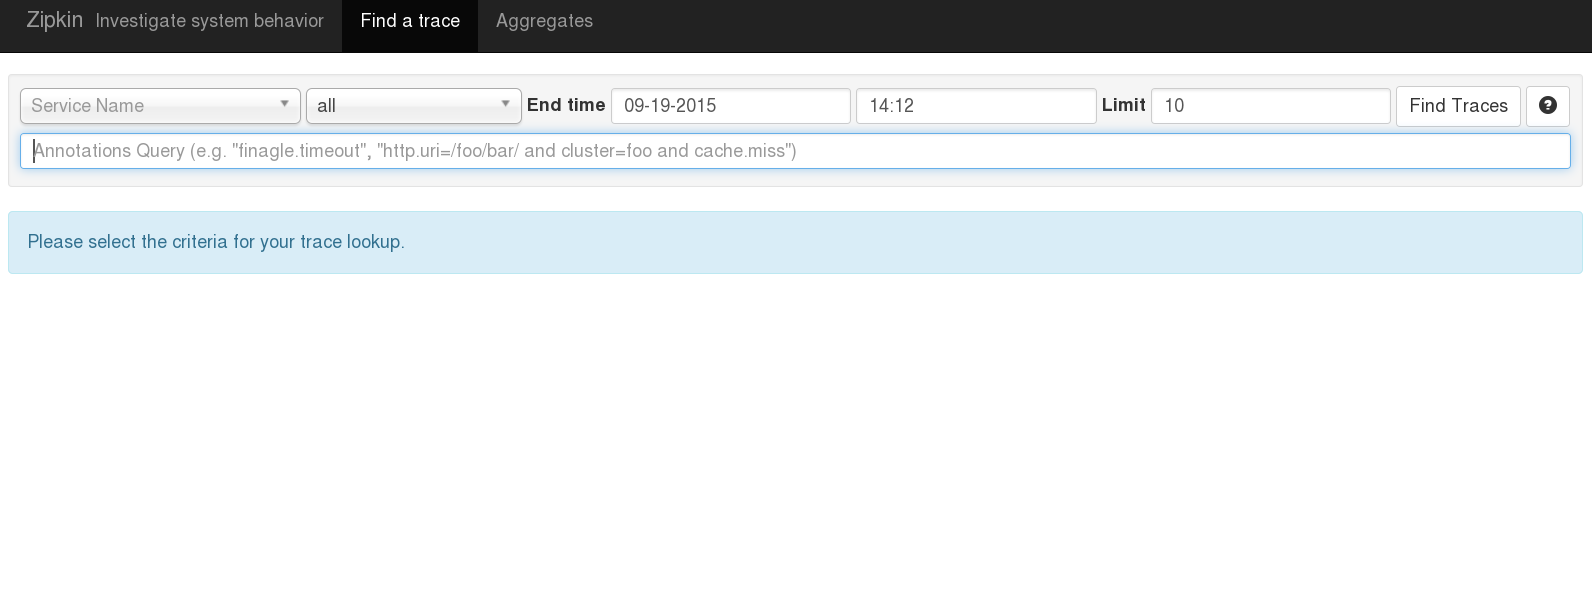
When it comes to explaining how Zipkin works it’s easier if we start with the user’s experience against the web UI and afterwards deal with the instrumentation requirements. The web UI has three main components: searching for traces, browsing those search results, and investigating an individual trace.
Searching for traces is done against time, the services involved, or even against specific annotations with a trace.
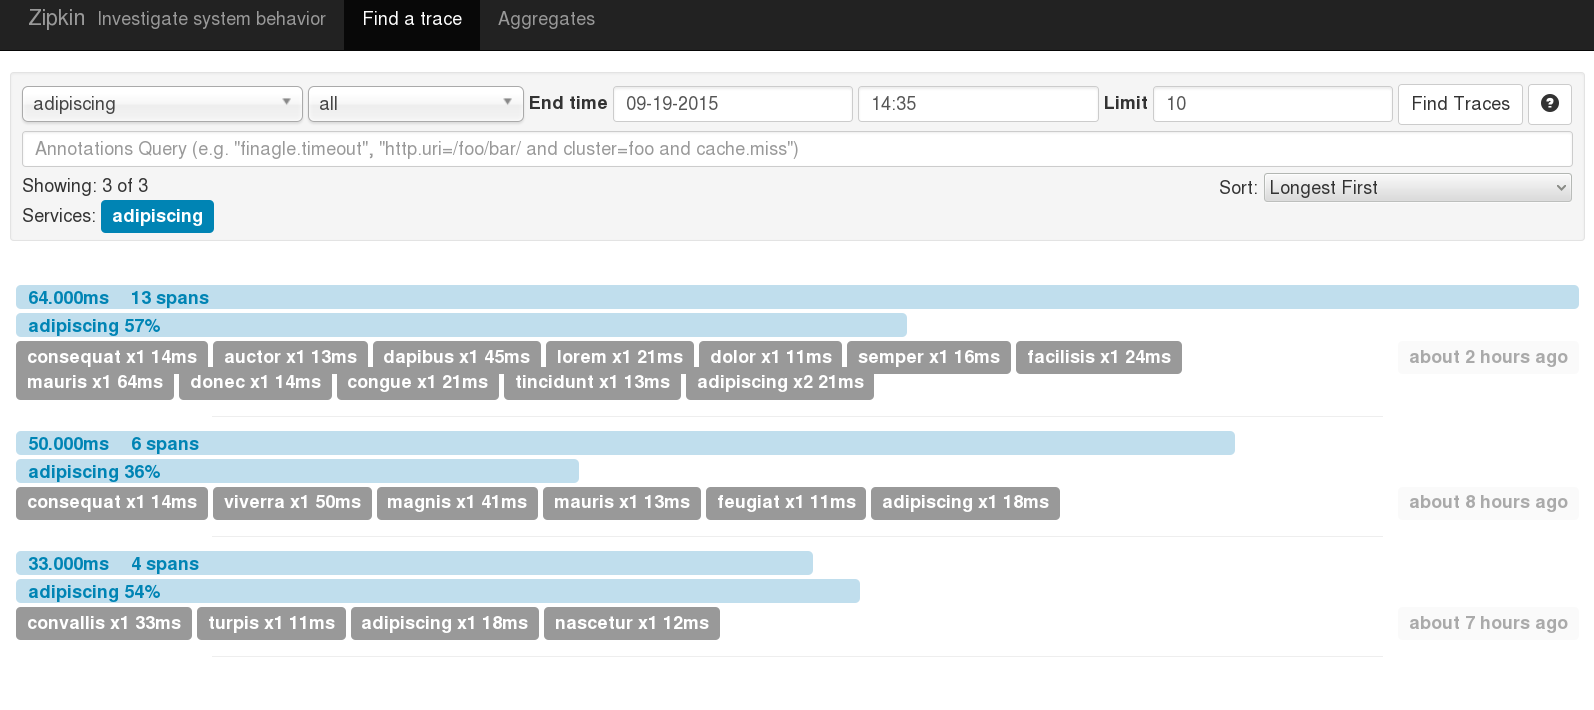
With the search results you can quickly see how many services, or for example network hops, were involved and the duration of each trace, and which services were involved in each. It’s also possible to show the longest traces first, making it easy to tackle poor 99th percentile latencies.
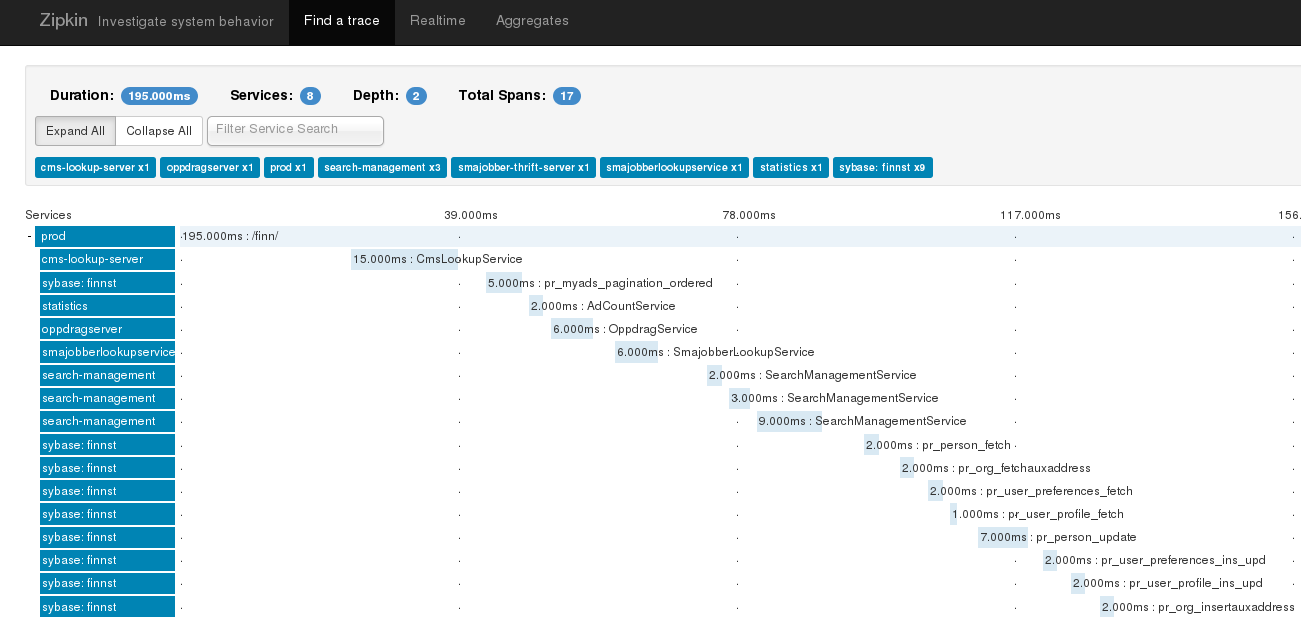
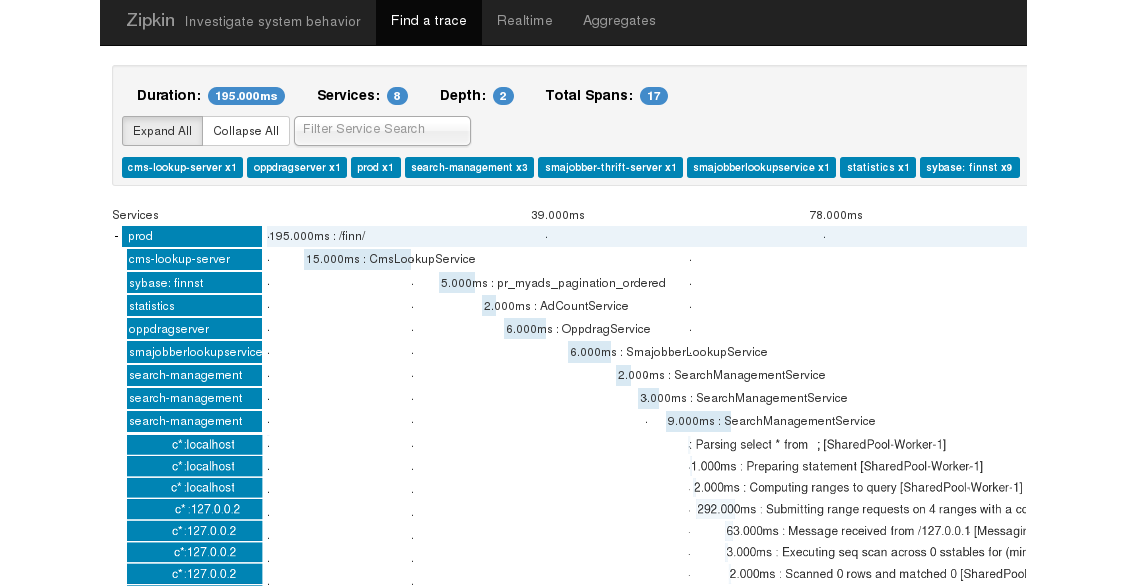
The top of the trace page shows you the duration, and the number of services and spans involved. Under that you can see the call hierarchy with the user’s initial request being made that took 195ms here and then all the underlying services or spans represented by the light blue stagger bars all the way down to database calls. In this example you can see that none of these spans executed concurrently, it all happened synchronously and sequentially.
The visualisation of the trace page is also possible via the Zipkin browser plugin, for example here in Firefox it gets added to the firebug extension. The plugin polls the Zipkin server for updates to the specific trace, displaying them near real-time. This is useful when developing webpages and insightful for frontend developers as they stay in touch and aware of all the services currently underlying the front end applications they are coding. Working in this manner usually suits decentralised autonomous teams. Having this type of information easily available also prevents blaming and finger-pointing as to who’s at fault for services not working and performing slowly and letting the platform down. This is useful also in testing environments.
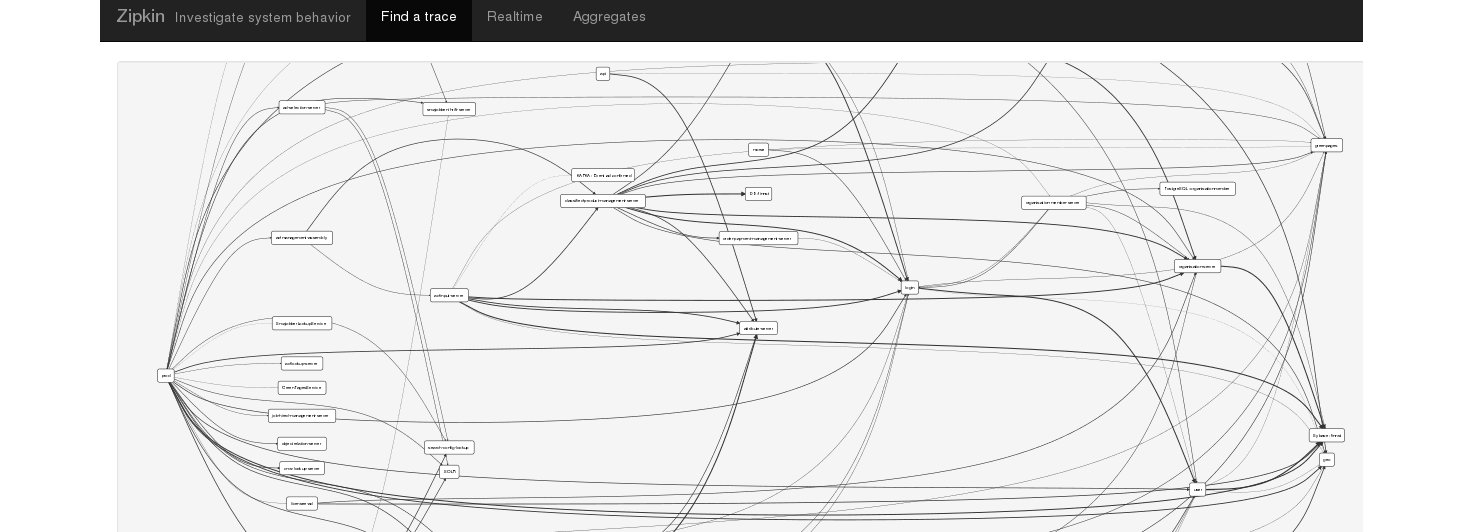
The transparency to the platform isn’t just for the front end developers. Being able to aggregate traces on a daily basis into a call or runtime service dependency graph goes a long way to help architects and management to understand accurately how things work, negating much of the need for higher level documentation.
Zipkin Internals
How does it all work? It really is very basic. Each span is initiated by the client with a “Client Send” or CS annotation. If the trace headers are exposed into the protocol being used and the server has Zipkin instrumentation implemented then the server will pick up these trace headers in the incoming request and initiate its server span with a “Server Received” or SR annotation. Once the server has processed the request and finishing the response, it notes this with a “Server Send” or SS annotation. When the client has the full response it completes the span with a final “Client Received” or CR annotation.
These instrumentation annotations can be sent to the Zipkin server individually but typically the annotations are buffered and sent altogether once either the server or client has finished their part of the span.
Take for example some code from a client making a request to a server that we want to trace. For example some code that’s making a rest call, might even be using Apache’s httpclient.
To put that tracing in, using the Zipkin Brave java library and its clientTracer class, is just a matter of wrapping a few lines of code around that call. This makes the CS and CR annotations which is enough to visualise the span in Zipkin.

The same thing can be done around a call to Cassandra. Here’s an example execute statement using the Datastax cql driver. And here’s the wrapping tracing lines.
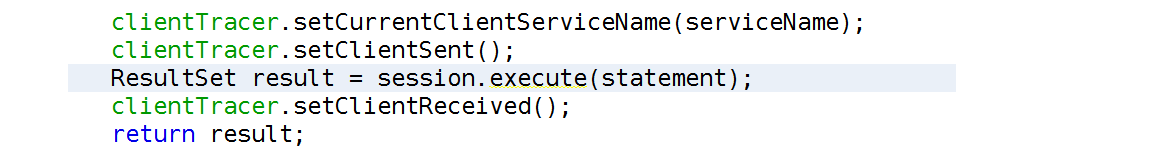
This is enough to create the spans in Zipkin, but tracing won’t continue onwards into the server or database. To do that you need to pass the tracing headers, a trace id, and a span id over the protocol. In the http protocol this is easy as they go in as request headers.

Tracing in Cassandra
So how does tracing work in Cassandra in comparison?
Tracing came to Cassandra in 1.2 It was intended specifically to address those requests creating latency. While it referenced the more complicated ways of tracing it explicitly stated that a sophisticated approach wasn’t needed. Tracing individual requests or turning on sampling and hunting for those poor requests can really help in speeding up a platform and fixing some of the hairy bugs.
The code that does the tracing in Cassandra is found in the tracing package and there’s surprisingly little to it, just four classes: ExpiredTraceState, TraceKeyspace, TraceState, and Tracing.
The flow to how the tracing works is like this. The only “annotations” in Cassandra are the trace(..) calls which emit trace messages at fixed points of time relative to when the request started.
        CO-ORDINATOR NODE                    REPLICA NODE
      --> ...
        beginSession(..)
            trace(..)
            trace(..)
                                        --> ...
                                            initialiseMessage(..)
                                                trace(..)
                                                trace(..)
                                        <-- ...
            trace(..)
        endSession(..)
      <-- ...
Replacing Cassandra tracing with Zipkin
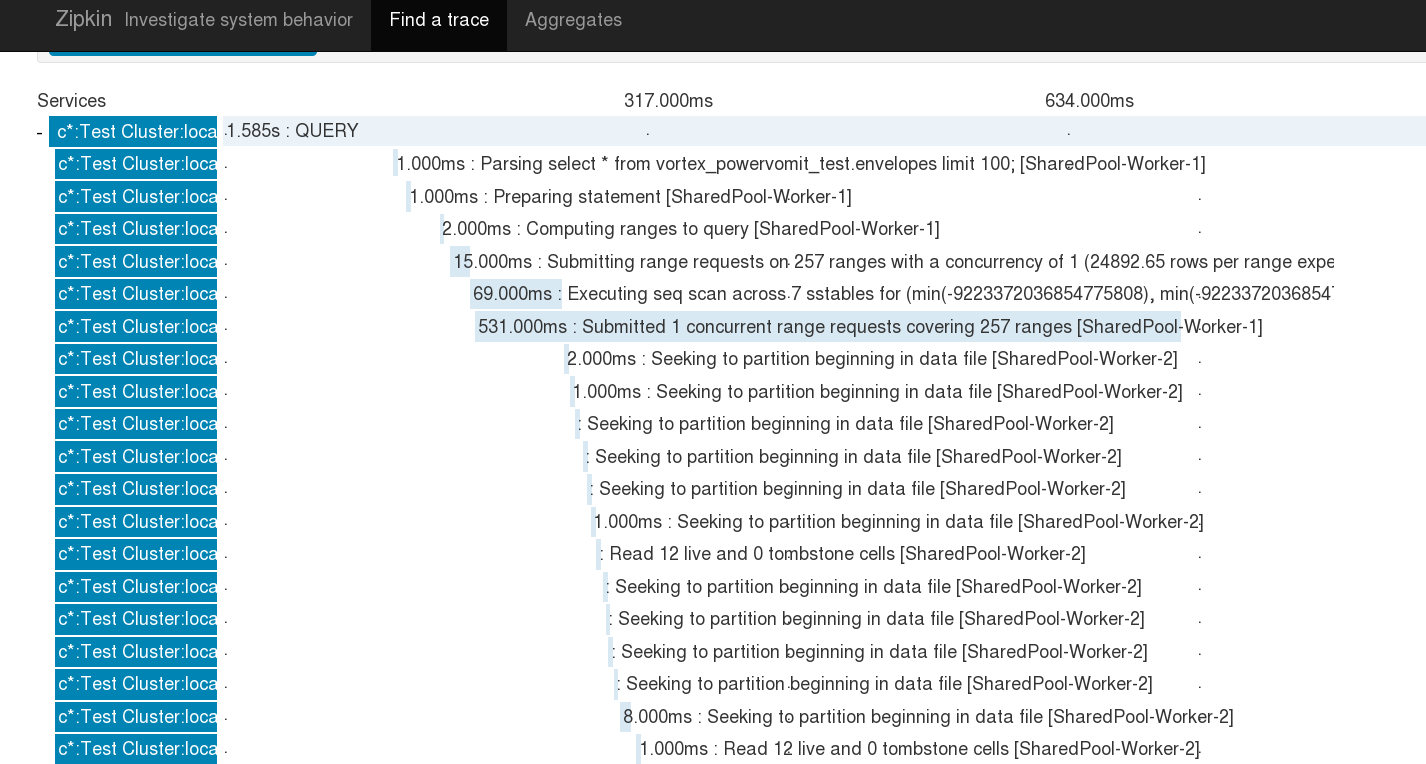
By replacing this code with Zipkin tracing there’s a lot to gain. The obvious is the visualisation. In addition we can see more detailed timings, and it’ll become clearer to see the hierarchy and asynchronicity of calls. It also becomes a tracing solution that has basically zero overhead. Rather that having a massive write amplification for all the trace annotations going back into the same Cassandra instance it’s now possible to offload that entire workload efficiently out onto separate infrastructure.
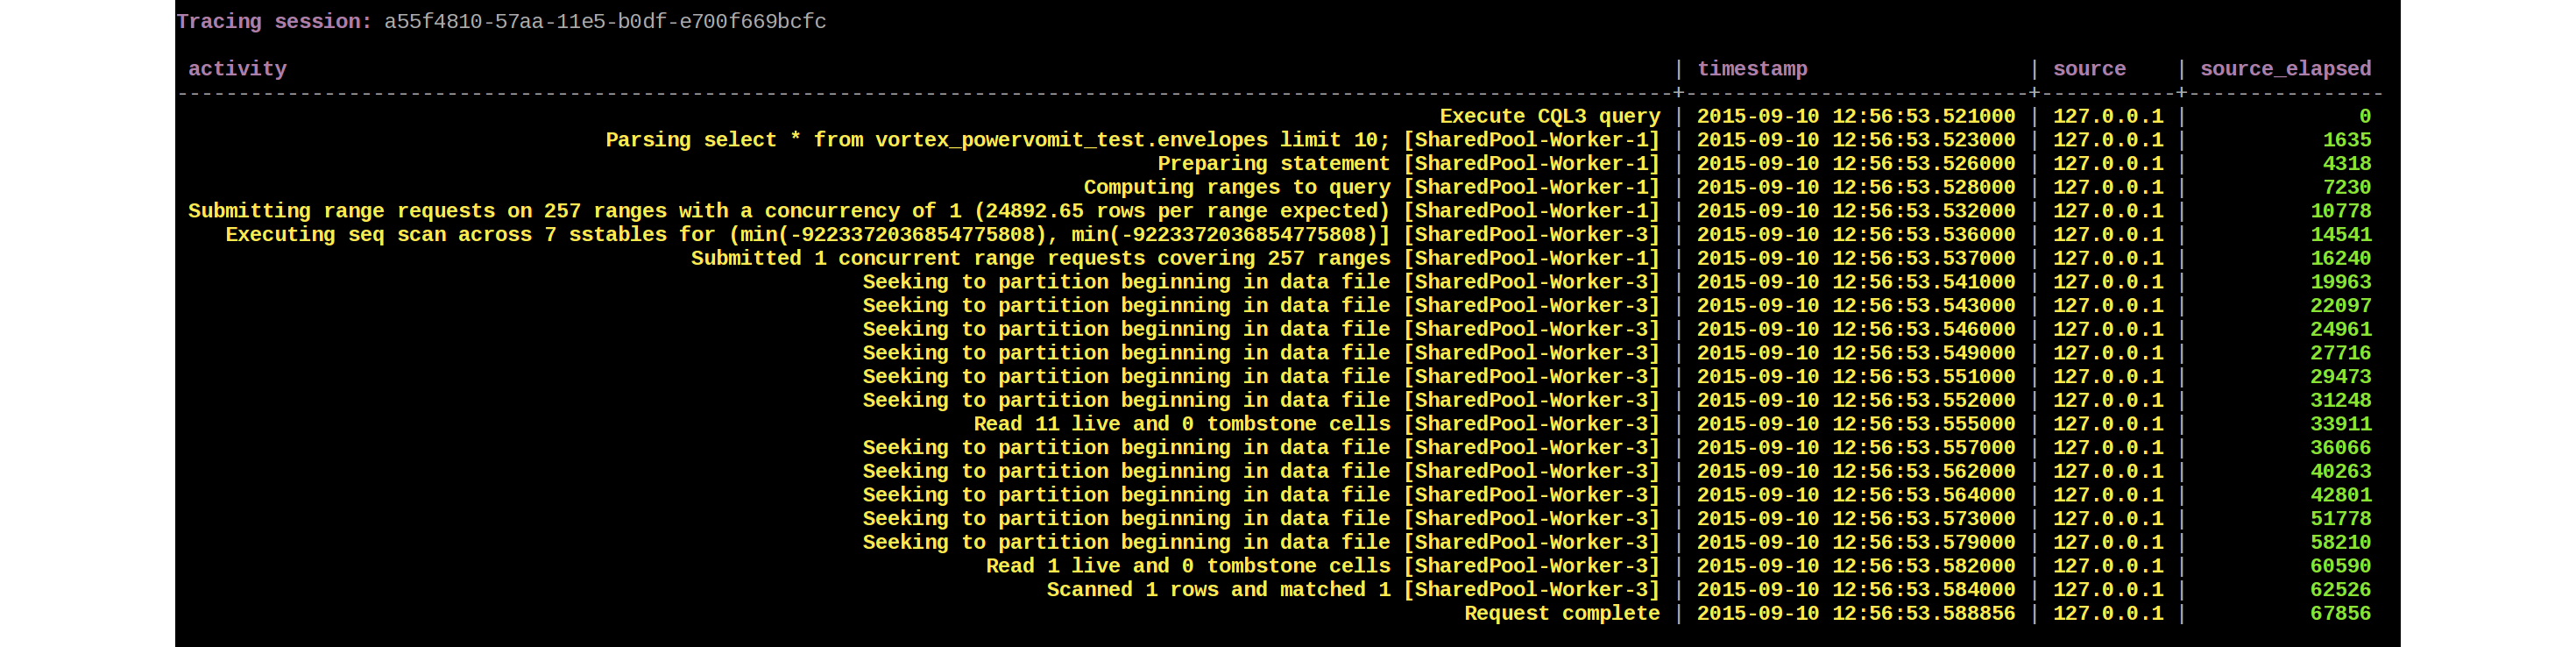
This work has been done under CASSANDRA-10392. Here’s a screenshot of the results on just one node, and you can see already that for a lot of developers new to Cassandra this is going to explain a lot more, much faster.
To achieve this only two classes: Tracing and TraceState; needed to be subclassed and one chunk of functionality moved into a new method in one of those classes so it could be overridden.
Zipkin Tracing across Cassandra nodes
Building on this, the code needs to do tracing across nodes. This involves the messaging service in Cassandra. The messaging service has an arbitrary map, much like http headers, that arbitrary key-values can be added to. By adding those Zipkin headers and reading them out again when we’re initialising a message, tracing across nodes is solved.
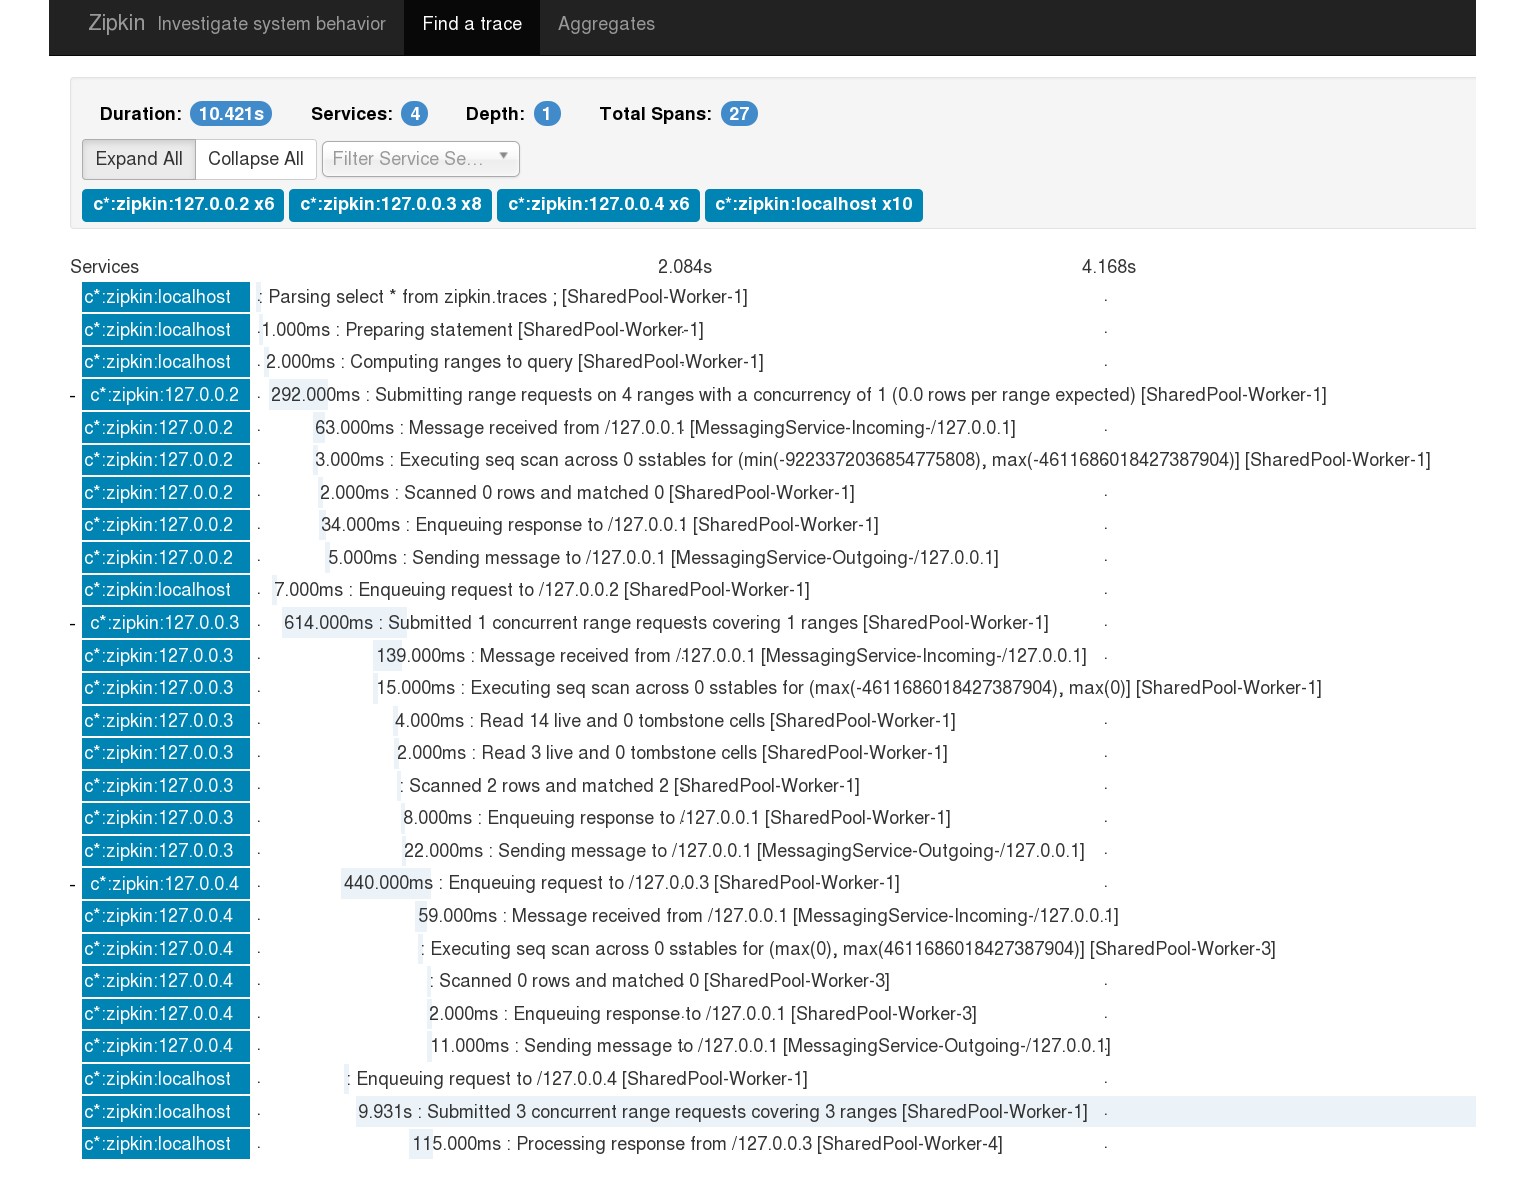
This is looking really cool, and as a Cassandra consultant this would make life a lot easier in a number of situations.
Full-stack Cassandra Zipkin Tracing
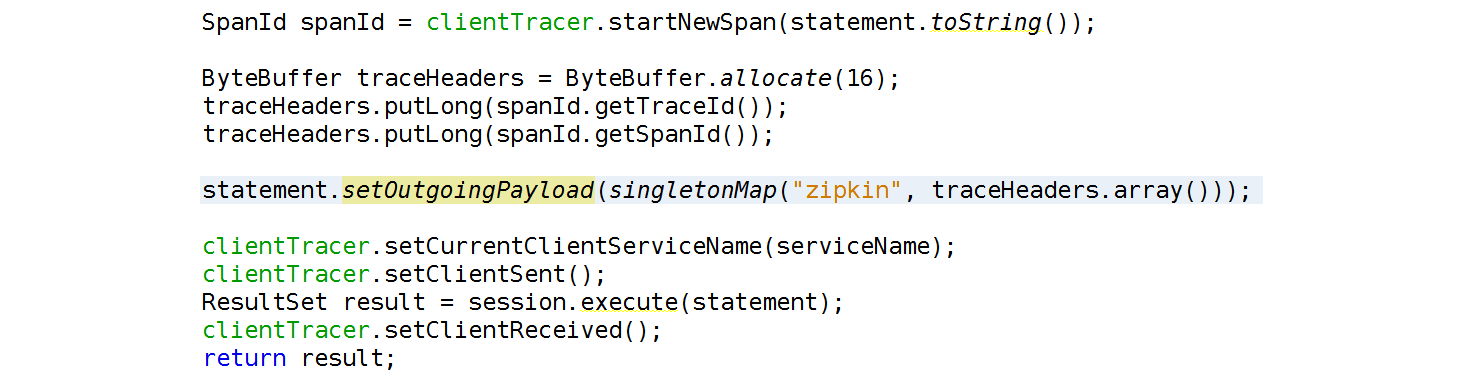
The last thing to do is to complete the idea of Zipkin doing proper distributed tracing through all applications. Somehow the Zipkin trace headers need to be propagated in with Cassandra requests so that the Zipkin trace displayed further above continues seamlessly into the Cassandra coordinator and further into each of Cassandra’s replica nodes.
To achieve this we take advantage of the work done in CASSANDRA-8553, released in Cassandra 2.2, which allows us to pass in arbitrary headers from client to server behind the scenes to a CQL request. Similar to the example with http headers it’s the traceId and the spanId we need to pass over the protocol. Here it’s to serialise the traceId and spanId in the one byte buffer and put it into the outgoing payload.
By connecting together our client applications and the Cassandra database we’re going to 1) solve a lot of bugs faster as we immediately known if they’re client-side or server-side, and 2) give more intuitive feedback to the platform developers on how Cassandra works internally.
This shows a whole new world of distributed tracing, across one’s platform and into distributed technologies like Cassandra. And it can be taken further… for example tracing could be visualised for anti-entropy repairs and compactions, helping to solve such problems as bad disks or cross-DC issues.
Summary
While monitoring provides information on system performance, tracing is necessary to understand individual request performance. Detailed query tracing has been provided by Cassandra since version 1.2 and is invaluable when diagnosing problems, although knowing which queries to trace and why the application makes them still requires deep technical knowledge. By merging application tracing via Zipkin and Cassandra query tracing we automate the process and make it easier to identify and resolve problems. Going further and proposing an extension that allows clients to pass a trace identifier through to Cassandra, and a way to integrate Zipkin tracing into Cassandra, creates one tracing view across the entire system.
The video for this talk presented at Santa Clara’s Cassandra Summit in 2015 is available here.