
Monitoring Cassandra garbage collector
Having database hiccups is the last thing you want on production. Very common cause of misbehaving nodes are long GC pauses — while running f.ex. full GC node doesn’t handle requests and if cycle is long enough then requests will timeout. I’ll describe how we monitor garbage collector in Cassandra clusters used by Opera sync so you can easily see affected nodes, spot patterns which are great help while debugging issues or tuning configuration.
You can configure C* to output GC logs to dedicated file through cassandra-env.sh. Edit this file and uncomment:
JVM_OPTS="$JVM_OPTS -XX:+PrintGCDateStamps"
JVM_OPTS="$JVM_OPTS -Xloggc:/var/log/cassandra/gc.log"
When done C* needs to be restarted. Soon after restart you should see in gc.log entries like:
2015–12–07T09:52:01.159+0000: 247122.436: [GC 6496818K->4840023K(8178944K), 0.0380030 secs]
How to parse and visualise these logs?
We’re using Logstash to parse logs and Kibana to display diagrams. GC-specific patterns are defined as follows:
FLOAT %{INT}\.[0–9]+
GCTYPE (GC)|(Full GC)
GCREASON [^)]+
JVMGCLOG (%{TIMESTAMP_ISO8601:timestamp}: )?%{FLOAT}: (#%{INT}: )?\[%{GCTYPE:gc_type} (\(%{GCREASON:gc_reason}\) )?%{INT:gc_memory_before:int}K->%{INT:gc_memory_after:int}K\(%{INT}K\), %{FLOAT:gc_duration:float} secs\]
and configuration to parse desired entries:
input {
  file {
    type => "cassandra-gc"
    path => "/var/log/cassandra/gc.log"
  }
}
filter {
if [type] == "cassandra-gc" {
grok {
patterns_dir => [ "/etc/logstash/conf.d/patterns" ]
match => [ "message", "%{JVMGCLOG}" ]
remove_field => [ "message" ]
} mutate {
add_field => [ "program", "cassandra-gc" ]
add_field => [ "fqdn", "db8.sync.ams.osa" ]
} if [gc_type] == "Full GC" {
mutate {
replace => [ "gc_type", "Full" ]
}
}
}
}output {
if [type] in [ "cassandra-gc" ] {
redis {
host => "logs.sync.ams.osa"
data_type => "list"
key => "logstash"
}
}
}To each log we’re adding “fqdn” field with hostname set to it. The value of this field is set by Puppet in our case. Having “fqdn” will allow us to filter based on specific host or datacenter (f.ex “ams.osa” to get only boxes in Amsterdam).
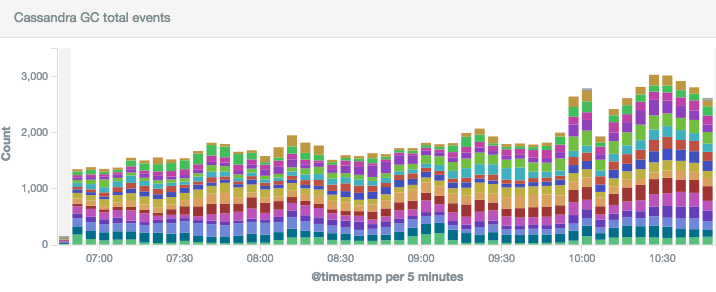
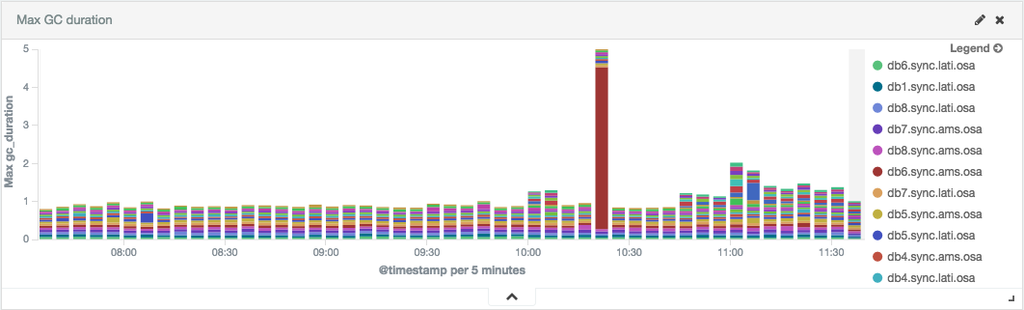
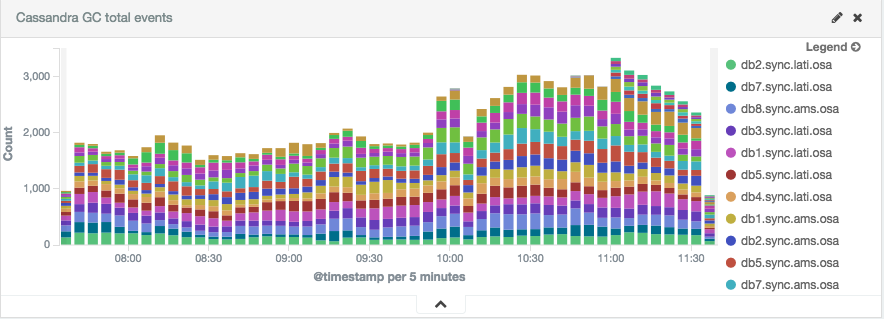
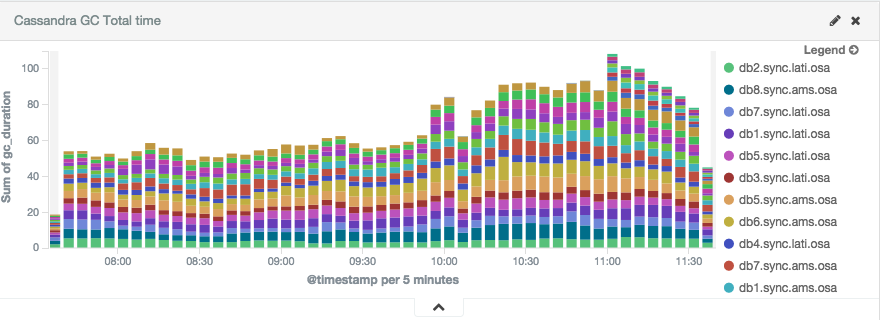
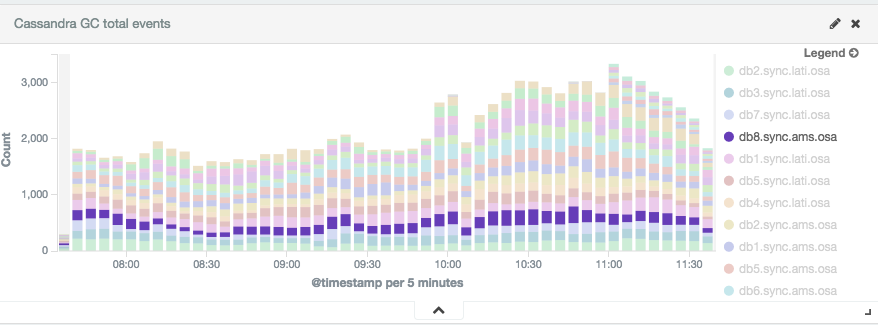
Having everything in Elasticsearch (passed through Redis) we can easily add dashboards in Kibana:
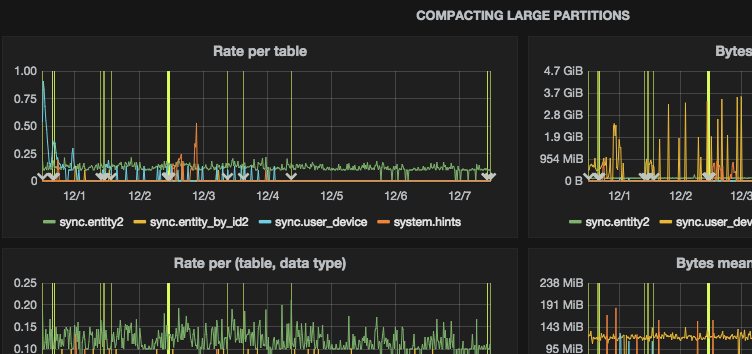
Setup we’ve can be applied to any tool on top of JVM where you want to monitor garbage collector. Logstash can be also helpful if you want to extract other information from Cassandra’s system.log like information about compacting large partitions:
WARN [CompactionExecutor:77446] 2015–12–07 08:02:40,920 SSTableWriter.java:241 — Compacting large partition sync/entity2:85373422:32904 (105951664 bytes)
Such information is easily parseable and is a great help while deciding if changes in database schema are required:
Using tool like jconsole, jstat or jvisualvm is extremely helpful while incidents but to have a bigger picture you need to have a history to detect patterns or make sure everything was fine last night or during last weekend. This is why we’re friends now with Logstash and Kibana. Right away you can say if current incident is caused by GC or you should start looking for problems in other places.
Having proper monitoring of garbage collector accompanied with tons of other metrics save us lots of time needed to diagnose issues or prove that latest changes in configuration actually make things better.