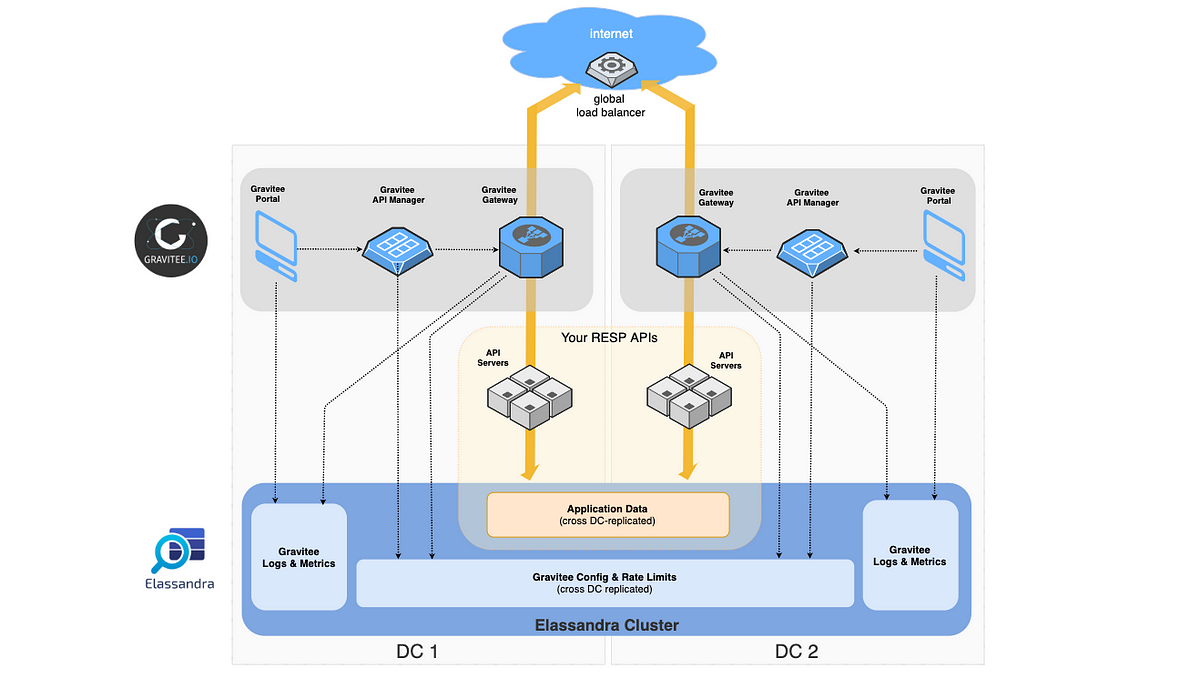
By default, the Gravitee API Manager rely on MongoDB for its configuration and Elasticsearch for log analytics, but deploying many components can by more tricky and more expensive than having a single distributed data store. To simplify the stack, the Gravitee repository for Elassandra can be used to store Gravitee configuration, Rate Limits, Logs and Metrics, along with your application data in Elassandra (aka Elasticsearch + Cassandra), with the following benefits:
- Distributed Gravitee configuration on many datacenters through the Cassandra replication (in active/active mode).
- Elasticsearch reporting for Gravitee analytics (gravitee logs and metrics).
- Scalability by adding Elassandra nodes (without re-indexing) and datacenters (for geo localisation concerns or workload separation)
- Reduce the global complexity and TCO by using the same NoSQL datastore for both Gravitee and APIs data storage.
We will now see how to deploy all these components under Kubernetes.
In order to expose the Gravitee components to the internet (gateways and management services), we obviously use Traefik, the modern reverse proxy. Traefik watches for incoming kubernetes ingresses events and automatically deploy routers, services, handlers, etc…
Traefik is deployed using a HELM Chart as follow:
3 Elassandra PODs has been deployed as a Kubernetes StatefulSet using this HELM chart.
IMPORTANT NOTE: Cassandra spread replicas across racks to ensure data remains available if a rack goes down. Deploying Cassandra or Elassandra with one Kubernetes StatefulSet cannot ensure that a pod are always deployed on the right cloud-provider zone or region. In order to meet this constraint, Strapdata will release soon a Kubernetes operator for Elassandra.
As shown in the main figure, Gravitee has 3 components:
- The manager service to manage the gravitee configuration
- The user interface (or portal)
- The gateways, to manager acces to your API endpoints
In order to deploy Gravitee including the Elassandra repository, we have used the HELM chart available at helm-gravitee. In the HELM values.yaml, the following es and elassandra blocks describe connection to both Elasticsearch (for Gravitee Analytics) and to Elassandra, which is very close to Apache Cassandra. The elassandra.endpoint specifies the Elasticsearch endpoint to be able to create and search across Elasticsearch indices.
Detail about deploying Gravitee under Kubernetes can be found here on Medium.
We deploy here a sample Micronaut application basketapp allowing to store and search baskets stored as JSON documents through a REST API. The basketapp stores its data into Elassandra, using Cassandra CQL to insert/select rows, and Elasticsearch queries through the CQL driver to search for documents.
This basic application is deployed as a Kubernetes deployment with an HELM chart included in the basketapp code.
When everything is deployed, we have the following pods running in our Kuberenetes cluster:
The 3 Gravitee components (api management, ui, and gateway) are accessible from outside the Kubernetes cluster through Traefik with an external load balancer.
On an Elassandra pod, we can check that the basketapp and the Gravitee Elasticsearch indices are green:
As described in the micronaut documentation, we use an annotation in the Micronaut Application.java, where the servers.url points to our application. Be careful, URL context path cannot be null:
The swagger descriptor is generated at compile time by Micronaut, and server URLs may depend on your deployments, so we introduced a controller to dynamically replace the servers.url with the application kuberenetes service name. The swagger descriptor is available from a pod at http://basketapp:8080/basketapp/swagger, the URL used to import the API into Gravitee:
- Log into the API Manager portal as the administrator and register your application by providing a swagger descriptor.
2. Start and publish the API
3. Create an API plan. To keep the demo simple, you choose a keyless authentication, but Gravitee provides many ways to secure access to your API.
4. Publish to the API plan and deploy it to the gateways.
You can request then your basket API through the Gravitee gateway service:
Thanks to Elassandra, Gravitee analytics works like Elasticsearch. You can check API performances, application load, and enable API logging for a while.