Cassandra nodetool provides several types of commands to manage your Cassandra cluster. See my previous post about Cassandra nodetool for an orientation to the types of things you can do with this helpful Cassandra administration tool. Here, I am sharing details about one type — getting Cassandra information about your installation using nodetool. These can be used to get different displays of the status and other insights into the Cassandra nodes and full cluster.
Cassandra nodetool is installed along with the database management software, and is used on the command line interface (e.g., inside the Terminal window), like this:

Let’s start with some very basic information about the node.
nodetool version
This will show the version of Cassandra running on this node. Another way to get similar information is by using cassandra -v.
Example output:
ReleaseVersion: 3.11.2
nodetool info
In the same way that the popular nodetool status (see below) provides a single-glance overview of the cluster, this command provides a quick overview of the node. It is a convenient way, for example, to see the memory usage.
Example output:
ID                     : 817788af-4209-44df-9ae8-dc345376c946
Gossip active          : true
Thrift active          : false
Native Transport active: true
Load                   : 749.07 KiB
Generation No          : 1526478319
Uptime (seconds)       : 15813
Heap Memory (MB)       : 72.76 / 95.00
Off Heap Memory (MB)   : 0.01
Data Center            : DC1
Rack                   : RAC1
Exceptions             : 0
Key Cache              : entries 35, size 2.8 KiB, capacity 4 MiB, 325 hits, 396 requests, 0.821 recent hit rate, 14400 save period in seconds
Row Cache              : entries 0, size 0 bytes, capacity 0 bytes, 0 hits, 0 requests, NaN recent hit rate, 0 save period in seconds
Counter Cache          : entries 0, size 0 bytes, capacity 2 MiB, 0 hits, 0 requests, NaN recent hit rate, 7200 save period in seconds
Percent Repaired       : 100.0%
Token                  : (invoke with -T/--tokens to see all 256 tokens)
Similarly, nodetool can provide basic information about the full cluster:
nodetool describecluster
This will show a quick view of some of the important cluster configuration values: name, snitch type, partitioner type, and schema version.
Example output:
Cluster Information:
Name: Dev_Cluster
Snitch: org.apache.cassandra.locator.GossipingPropertyFileSnitch
DynamicEndPointSnitch: enabled
Partitioner: org.apache.cassandra.dht.Murmur3Partitioner
Schema versions:
414b0faa-ac94-3062-808b-8f1e6776d456: [172.16.238.2, 172.16.238.3, 172.16.238.4, 172.16.238.5, 172.16.238.6, 172.16.238.7]
The “Schema Versions”: segment is especially important because it identifies any schema disagreements you might have between nodes. Every time a schema is changed, the schema is propagated to the other nodes. Sometimes you might see some persistent schema disagreements that could indicate that one of the nodes is down, and this is often resolved by either restarting the node or by doing a rolling restart to the entire node.
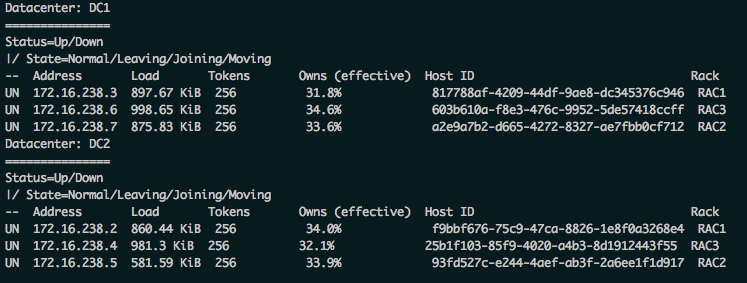
nodetool status
If you run just one nodetool command on a server when you log in, this is it: a brief output of node state, address and location.
Example output:
Datacenter: DC1
===============
Status=Up/Down
|/ State=Normal/Leaving/Joining/Moving
--  Address       Load Tokens       Owns (effective) Host ID                               Rack
UN  172.16.238.2  749.07 KiB 256          31.8% 817788af-4209-44df-9ae8-dc345376c946  RAC1
UN  172.16.238.3  471.93 KiB 256          33.6% a2e9a7b2-d665-4272-8327-ae7fbb0cf712  RAC2
UN  172.16.238.4  749.49 KiB 256          34.6% 603b610a-f8e3-476c-9952-5de57418ccff  RAC3
Datacenter: DC2
===============
Status=Up/Down
|/ State=Normal/Leaving/Joining/Moving
--  Address       Load Tokens       Owns (effective) Host ID                               Rack
UN  172.16.238.5  528.98 KiB 256          34.0% f9bbf676-75c9-47ca-8826-1e8f0a3268e4  RAC1
UN  172.16.238.6  566.61 KiB 256          33.9% 93fd527c-e244-4aef-ab3f-2a6ee1f1d917  RAC2
UN  172.16.238.7  809.37 KiB 256          32.1% 25b1f103-85f9-4020-a4b3-8d1912443f55  RAC3
Other nodetool status commands can provide information about backups:
nodetool statusbackup
Use this to view the status of incremental backups. If you have turned on incremental backups (e.g., via nodetool enablebackup), then the status will be running. If the incremental backups are disabled, the status will be not running.
Example output:
running
nodetool listsnapshots
Use this command to view the schema snapshots on this node. This assumes you have created at least one snapshot (e.g., with nodetool snapshot).
Example output:
Snapshot Details:
Snapshot name Keyspace name      Column family name True size Size on disk
1526402908000 system_distributed parent_repair_history          0 bytes 13 bytes
1526402908000 system_distributed repair_history                 0 bytes 13 bytes
1526402908000 system_distributed view_build_status              0 bytes 13 bytes
1526402908000 keyspace1          standard1 1.51 MiB  1.51 MiB
1526402908000 keyspace1          counter1 0 bytes   864 bytes
1526402908000 system_auth        roles 0 bytes   13 bytes
1526402908000 system_auth        role_members 0 bytes   13 bytes
1526402908000 system_auth        resource_role_permissons_index 0 bytes   13 bytes
1526402908000 system_auth        role_permissions 0 bytes   13 bytes
1526402908000 system_traces      sessions 0 bytes   13 bytes
1526402908000 system_traces      events 0 bytes   13 bytes
Total TrueDiskSpaceUsed: 1.51 MiB
Understand the details of your schema and data around the cluster with the following commands:
nodetool ring
This command will produce a very long output of all tokens (primary key hashes) on a given node.
Example output:
Datacenter: DC1
==========
Address       Rack Status State   Load Owns         Token
172.16.238.3  RAC2 Up     Normal 421.98 KiB     32.70% -9220489979566737719
172.16.238.2  RAC1 Up     Normal 589.17 KiB     34.48% -9115796826660667716
172.16.238.3  RAC2 Up     Normal 421.98 KiB     32.70% -9100537612334946272
...
nodetool describering
View detailed information on tokens present on a given node. Use a keyspace name along with this command (e.g., nodetool describering keyspace1).
Example output:
Schema Version:d7d68b06-5c21-3aa4-a2e4-f44eff6e25e3
TokenRange: TokenRange(start_token:2266716358050113757, end_token:2267497540130521369, endpoints:[172.16.238.6, 172.16.238.3], rpc_endpoints:[172.16.238.6, 172.16.238.3], endpoint_details:[EndpointDetails(host:172.16.238.6, datacenter:DC1, rack:RAC2), EndpointDetails(host:172.16.238.3, datacenter:DC2, rack:RAC1)]) TokenRange(start_token:-3767342014734755518, end_token:-3764135679630864587, endpoints:[172.16.238.6, 172.16.238.5], rpc_endpoints:[172.16.238.6, 172.16.238.5], endpoint_details:[EndpointDetails(host:172.16.238.6, datacenter:DC1, rack:RAC2), EndpointDetails(host:172.16.238.5, datacenter:DC2, rack:RAC3)]) TokenRange(start_token:-7182326699472165951, end_token:-7168882311135889918, endpoints:[172.16.238.3, 172.16.238.6], rpc_endpoints:[172.16.238.3, 172.16.238.6], endpoint_details:[EndpointDetails(host:172.16.238.3, datacenter:DC2, rack:RAC1), EndpointDetails(host:172.16.238.6, datacenter:DC1, rack:RAC2)]) TokenRange(start_token:-4555990503674633274, end_token:-4543114046836888769, endpoints:[172.16.238.5, 172.16.238.4], rpc_endpoints:[172.16.238.5, 172.16.238.4], endpoint_details:[EndpointDetails(host:172.16.238.5, datacenter:DC2, rack:RAC3), EndpointDetails(host:172.16.238.4, datacenter:DC1, rack:RAC3)])...
nodetool rangekeysample
This command will display a distribution of keys around the cluster.
Example output:
RangeKeySample: 2401899971471489924 8125817615588445820 6180648043275199428 -7666714398617260110 -59419700177700973...
nodetool viewbuildstatus
Materialized views are populated in the background. This command will show the status of this building process. Specify the keyspace and view name (e.g., nodetool viewbuildstatus keyspace1 mv1). As the process runs, the output will change accordingly. (Note that materialized views are not recommended to be used in production.)
Example output:
keyspace1.mv1 has not finished building; node status is below.
Host          Info
/172.16.238.4 STARTED
/172.16.238.2 STARTED
/172.16.238.7 UNKNOWN
Later:
keyspace1.mv1 has not finished building; node status is below.
Host          Info
/172.16.238.4 SUCCESS
/172.16.238.2 STARTED
/172.16.238.7 SUCCESS
Finally:
keyspace1.mv1 has finished building
nodetool getendpoints
Use getendpoints to find the node(s) holding a partition key using keyspace, table name and token.
First, retrieve the key:
select key from keyspace1.standard1 where [your search terms];
 key
------------------------
 0x3138324b305033384e30
Then use the key to find the node(s):
nodetool getendpoints keyspace1 standard1 3138324b305033384e30
172.16.238.7
172.16.238.2
The inner workings of the Cassandra cluster are made more clear with the following nodetool commands.
nodetool compactionstats
This command will display active and pending compactions.
Compactions are often intensive in terms of I/O and CPU, so monitoring pending compactions is often useful if you see any performance degradation or want to track operations such as repairs, SSTableupgrades, or rebuilds.
Example output:
pending tasks: 0
nodetool compactionhistory
Similarly, this command will show completed compactions.
Example output:
4ed95830-5907-11e8-a690-df4f403979ef keyspace1     standard1 2018-05-16T12:47:35.731 1461715  1461715 {1:6357}
2de781b0-5907-11e8-a690-df4f403979ef keyspace1     standard1 2018-05-16T12:46:40.459 1462110  1461715 {1:6357}
nodetool gcstats
A summarized view of garbage collection (gc) for a given node, in milliseconds since the last gc, is shown with this command. This might be useful for a dashboard display or for quick insight into the server.
Example output:
       Interval (ms) Max GC Elapsed (ms)Total GC Elapsed (ms)Stdev GC Elapsed (ms)   GC Reclaimed (MB) Collections Direct Memory Bytes
            20073305            9154 71095                 703 4353376560 305                       -1
nodetool statusgossip
The node reports briefly whether or not it is communicating metadata to/from other nodes with this command. The default will be on unless it has been turned off (e.g., with nodetool disablegossip), perhaps for maintenance. If it is on, the output will be running. If gossip is disabled, the output will be (as you might guess) not running.
Example output:
Running
nodetool gossipinfo
Assuming gossip is enabled, this will show what this node is communicating to other nodes in the cluster about itself.
Example output:
/172.16.238.2
  generation:1526415339
  heartbeat:21284
  STATUS:21216:NORMAL,-1122832159022483270
  LOAD:21238:6569245.0
  SCHEMA:12719:d386650c-2a99-336d-a7a8-9c25a4f39801
  DC:8:DC1
  RACK:10:RAC1
  RELEASE_VERSION:4:3.11.2
  INTERNAL_IP:21218:172.16.238.2
  RPC_ADDRESS:3:172.16.238.2
  NET_VERSION:1:11
  HOST_ID:2:817788af-4209-44df-9ae8-dc345376c946
  RPC_READY:58:true
  TOKENS:21215:<hidden>
...
nodetool statushandoff
Hinted handoff might be turned off manually if you think a node will be down for too long (longer than max_hint_window_ms), or to avoid the traffic of hints over network when the node recovers. If it is running, the output will be Hinted handoff is running. If it has been disabled, the output will be Hinted handoff is not running.
Example output:
Hinted handoff is running
nodetool tpstats
Usage statistics of the thread pools are shown with this command. The details of thread pool statistics warrant a separate blog entry, but meanwhile, the Cassandra documentation will provide a basic overview.
Example output:
Pool Name                         Active Pending Completed Blocked  All time blocked
ReadStage                              0 0 1789 0              0
MiscStage                              0 0 0 0              0
CompactionExecutor                     0 0 13314 0              0
MutationStage                          0 0 36069 0              0
MemtableReclaimMemory                  0 0 82 0              0
PendingRangeCalculator                 0 0 12 0              0
GossipStage                            0 0 132003 0              0
SecondaryIndexManagement               0 0 0 0              0
HintsDispatcher                        0 0 3 0              0
RequestResponseStage                   0 0 15060 0              0
Native-Transport-Requests              0 0 3390 0              2
ReadRepairStage                        0 0 6 0              0
CounterMutationStage                   0 0 0 0              0
MigrationStage                         0 0 10 0              0
MemtablePostFlush                      0 0 118 0              0
PerDiskMemtableFlushWriter_0           0 0 82 0              0
ValidationExecutor                     0 0 0 0              0
Sampler                                0 0 0 0              0
MemtableFlushWriter                    0 0 82 0              0
InternalResponseStage                  0 0 5651 0              0
ViewMutationStage                      0 0 0 0              0
AntiEntropyStage                       0 0 0 0              0
CacheCleanupExecutor                   0 0 0 0              0

Message type           Dropped
READ                         0
RANGE_SLICE                  0
_TRACE                       0
HINT                         0
MUTATION                   843
COUNTER_MUTATION             0
BATCH_STORE                  0
BATCH_REMOVE                 0
REQUEST_RESPONSE             0
PAGED_RANGE                  0
READ_REPAIR                  0
Finally, the following nodetool commands will provide information to support Cassandra performance tuning efforts.
nodetool proxyhistograms
This command will give an overall sense of node performance, showing count and latency in microseconds. The values will be calculated as an average of the last 5 minutes.
Example output:
proxy histograms
Percentile       Read Latency Write Latency      Range Latency CAS Read Latency CAS Write Latency View Write Latency
                     (micros) (micros)           (micros) (micros) (micros)           (micros)
50%                   5839.59 8409.01           30130.99 0.00     0.00 0.00
75%                  14530.76 20924.30           89970.66 0.00    0.00 0.00
95%                  52066.35 155469.30          268650.95 0.00      0.00 0.00
98%                 107964.79 223875.79          268650.95 0.00     0.00 0.00
99%                 155469.30 268650.95          268650.95 0.00     0.00 0.00
Min                        263.21 315.85               5839.59 0.00 0.00               0.00
Max                 386857.37 464228.84          268650.95 0.00     0.00 0.00
nodetool tablehistograms
This command displays count and latency as a measure of performance for a particular table. Specify the keyspace and table name when running tablehistograms. These values are also calculated over the last 5 minutes.
Example output:
keyspace1/standard1 histograms
Percentile  SSTables Write Latency      Read Latency Partition Size      Cell Count
                              (micros) (micros)       (bytes)
50%             0.00 152.32            454.83 NaN     NaN
75%             0.00 654.95           1629.72 NaN       NaN
95%             0.00 4866.32          10090.81 NaN         NaN
98%             0.00 8409.01          25109.16 NaN         NaN
99%             0.00 8409.01          30130.99 NaN         NaN
Min             0.00 20.50             51.01 NaN   NaN
Max             0.00 14530.76         155469.30 NaN           NaN
nodetool tablestats
This will show the read/write count and latency per keyspace, and detailed count, space, latency and indexing information per table. Note that this used to be called nodetool cfstats, so you will still see some references to that tool around (and cfstats is still aliased to tablestats).
nodetool toppartitions
This command displays top partitions used for a table during a specified sampling period, in milliseconds. Cardinality is a count of unique operations in the sample. Count is the total number of operations during the sample per partition. The third column in the partition display (+/-) indicates the margin of error; an estimate rather than an exact count is captured to avoid overhead. Specify the keyspace, table name and desired duration of sample.
Example output:
WRITES Sampler:
Cardinality: ~3 (256 capacity)
Top 10 partitions:
Partition  Count +/-
31344f50364f34343430 39 38
314c4c33373737333830 39 38
4b394e304e31334d4c30 39 38
4b32304e4d38304e3730 39 38
5034333737304b324d30 39 38
383335344e4b354c5030 39 38
343037374e33384b3331 39 38
3438504e324d4f345030 39 38
4f4f3834334f33333731 39 38
30353131333531343331 39 38

READS Sampler:
Cardinality: ~2 (256 capacity)
Top 10 partitions:
Partition Count +/-
4b3137304d3435303930 37 36
3431324b32334d354c30 37 36
4e31313739354c393930 37 36
34335039334c50303630 37 36
334e3437503839313131 37 36
314f31303933364c3130 37 36
4d4c36343533354b3431 37 36
4c4d334e4f4e31343530 37 36
4e324d394f3450343130 37 36
39364c30503634333930 37 36
The above has been a review of the informational commands available with Cassandra nodetool. Again, see my previous post for an orientation to Cassandra nodetool, and stay tuned for future posts on combining nodetools commands for administration tasks such as backups, performance tuning and upgrades.
Interested in working with Valerie? Schedule a tech call.